The general concept of our software is a strict separation of geometry from the technique of drawing. Its main principles are the use of line graphics, central projection and independent visibility checks.
We use line graphics which means that we only draw curves. Line graphics are most suitable for the representation of results in differential geometry.
Surfaces are represented by families of curves on them, usually their parameter lines. Thus we do not need a special strategy or technique for the graphical representation of surfaces and only need two general objects.

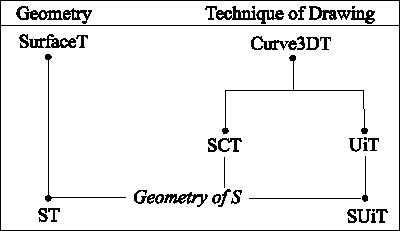
Figure 2. The hierarchy tree of objects for the representation of a given surface S
At the root of the hierarchy tree on the geometry side, there is the general object type SurfaceT. It contains the methods needed in the mathematical description of surfaces, in particular the virtual methods ParToSurf and SurfToPar to transform parameter points into points on the surface and vice versa. At the root of the hierarchy tree on the side of the technique of drawing, there is the object type Curve3DT which contains all the methods and procedures needed to draw three-dimensional curves. Its successor UiT is needed to draw parameter lines on surfaces. On the geometry side, ST is a successor of SurfaceT. It contains the special methods and procedures needed for the geometry of the given surface S. At this level, the procedures ParToSurf and SurfToPar have to be declared according to the parametric representation of the surface S. The object types SCT, a successor of Curve3DT, and SUiT, a successor of UiT, are needed to draw the contour line and the parameter lines of S. Again, the geometry of S has to be implemented into them.
Curves may be given by parametric representations or equations and are approximated by polygons. Line graphics causes no problem in the graphical representation of lines on surfaces or lines of intersections of surfaces, which is a major difficulty in many commercial software packages.
A disadvantage of the use of line graphics is that we are faced with a contour problem.
We use an independent procedure Check to test the visibility of our geometric objects. Thus we are free to manipulate to show desirable but unrealistic effects or not to use any test at all for a fast first sketch.
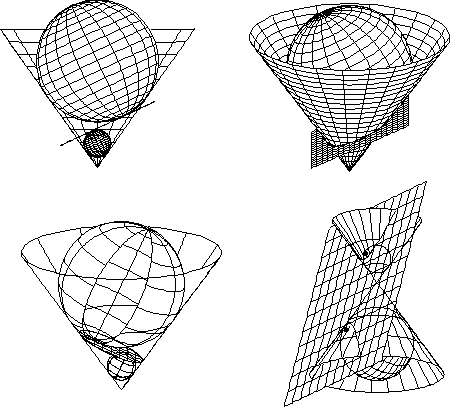
Example 1. Dandelin's spheres
The uniquely defined spheres that are both tangent to a cone and an intersecting plane are called Dandelin's spheres.
They are tangent to the plane of intersection at the foci of the resulting conic section.

Figure 3. Dandelin's spheres, concept, reality and desirable representation
The visibility of every point is immediately tested analytically. Thus our graphics are generated in a geometrically natural way.
Two consecutive points in the approximation of a curve are joined by a straight line segment if and only if both of them are visible. We use interpolation to close occasional gaps. This is less time consuming than increasing the overall number of points for the approximation. There is an option to either dot or omit invisible parts.