|
(Italy)
Abstract Contour plots can be a tool to generate
symmetrical and periodic patterns in the plane provided that the characteristics
of symmetry and periodicity belong to the function of two independent variables
from which the contour plot is derived; in this paper we show some examples
of patterns obtained by using a particular family of functions.
1. Some remarks about contour plots
Let us consider a generic real function f(x, y, z) in the space; the set of real and finite values of the constant c satisfying the equation:
represents a family of surfaces named level surfaces. In analogous way, if f is function of
x and y only, the equation:
describes, for different values of the constant c, curves in plane whose name is level lines or contour plots. In many physics and engineering applications,
contour plots are often used to visually describe the characteristics of
a scalar field (e.g. pressure, temperature, density etc.); infact by drawing,
in the domain of interest, a certain number of contour plots corresponding
to certain values of the constant c, one can get information about of the
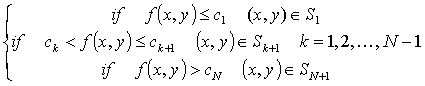
intensity of the field under study. Thus, if N is the number of contour
plots choosen to decribe the field and {ci } (i=1,2,..N) is
a set of constants associated to each one of the contour plots, one can
univocally partition the considered region of the plane by means of the
set {Sk}(k=1,2,..,N+1) generated according to the following
rule:
A better idea of the field intensity is got if we univocally associate to each set Sk a certain arbitrary colour (i.e we create a colour map). The idea at the basis of this paper
is to use contour plots in order to generate symmetrical and periodic patterns;
clearly the symmetry and periodicity properties of the patterns take origin
from a suitable choice of the function f(x,y) but the final result is also
due to the number N of contour plot choosen and to the colours combination
of the color map adopted.
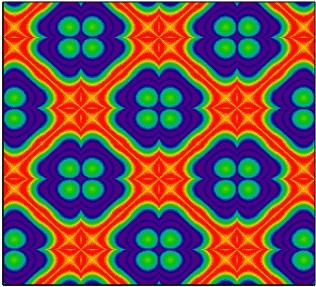
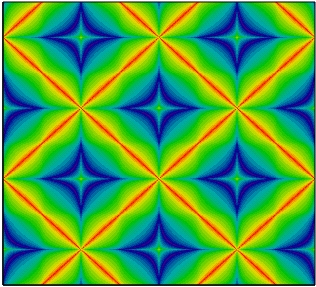
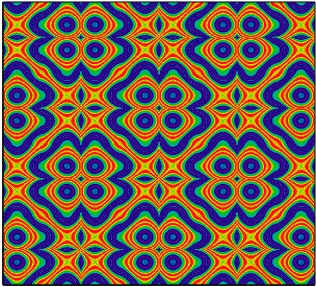
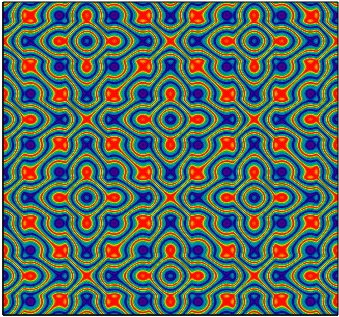
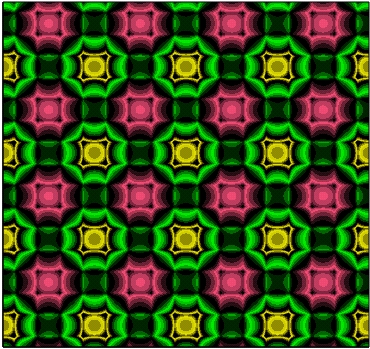
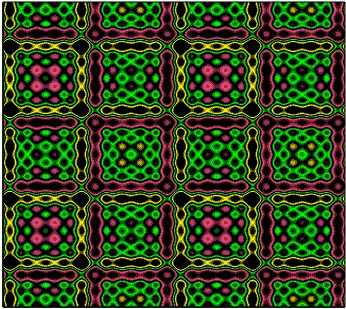
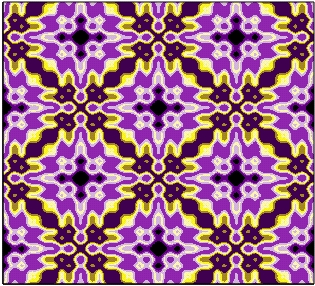
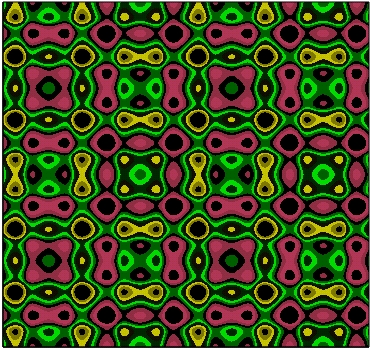
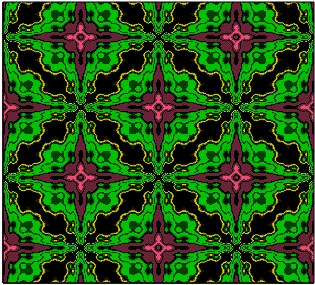
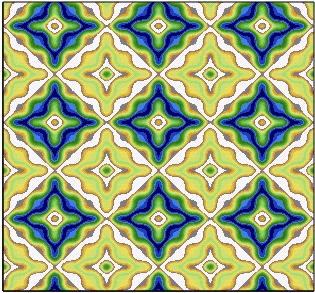
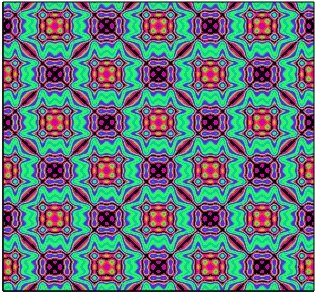
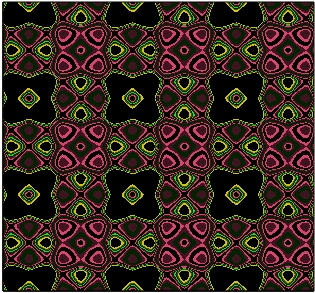
2. Examples
In this paragraph, we show some examples
of patterns that have been generated by using a particular family
of functions f(x,y) defined as follows:
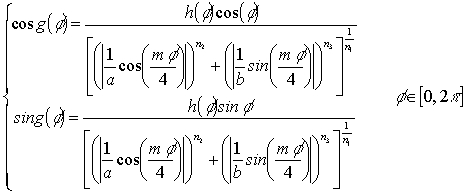
where A, B, C, D are arbitrary real constants and the functions cosg and sing are given by:
In formula (5) a, b are strictly positive real numbers, (i.e. different from 0), while n1, n2, n3 and m are real positive numbers and h is a factor which can be 1 or, more generally, a function expressed as a Fourier series of sines and cosines whose arguments are multiples of the angle f. More information about formula (5) can be found in [1] and in [2]; the main advantage of such a formula consists in the possibility of easily drawing a wide range of plane curves with any degree of rotational symmetry. In the examples that follow, we have
considered patterns where the rotational symmetry of degree four is quite
evident; this a consequence of the value m=4 adopted in formula (5). The
results of this choice are shapes similar to four-leaved clovers, crosses,
diamonds which are clearly emerging and dominating the pattern.
Fig.1
Fig.2
Fig.3
Fig.4
Fig.5
Fig.6
Fig.7
Fig.8
Fig.9
Fig.10
Fig.11
Fig.12 REFERENCES
[1] J. Gielis:
''A Generic Geometric Transformation That Unifies a Wide Range of Natural
and Abstact Shapes'', American Journal of Botany 90(3): 333-338.
2003.
[2] www.geniaal.be
|
 (1)
(1) (3)
(3) (5)
(5)