|
Anatomy of a Bud Jay Kappraff Department of Mathematics New Jersey Institute of Technology University Heights Newark, NJ, 07102, USA E-mail: Kappraff@aol.com
Abstract
For more than sixty years, Lawrence Edwards,
a mathematician and scientist from Scotland has been studying the shape
of natural forms such as plants, melons, birds eggs, the human heart and
the watery vortex. He used invariant curves from projective geometry known
as path curves to describe natural forms [1],[2],[3].
We shall illustrate Edwards's method of analysis as it applies to describing
bud form. We shall then describe his work over the past forty years which
indicates that bud shape subtly changes over a fourteen day period and
so is linked to the lunar cycle. Edwards has also observed that the time
of maximum shape change correlates with the alignment of the Earth, moon,
and a planet specific to the species of bud. These unusual results command
attention because of the meticulous care in which Edwards has carried forth
this research. He has been available nearly every day to make his measurements
using sophisticated equipment and techniques of analysis described in Section
4. Over the duration of his life which ended in January of 2004 at
age 92 he made more than 50,000 measurements of the buds.
2. Path curves and the parameter Lambda The projective geometry of path curves is covered in several references [1,2,3]. The results are summarized as follows: * Projective transformations that map points to points and lines to lines are called collineations. * It is fundamental to projective geometry that collineations leave, in general, three points (real or imaginary) invariant. If the fixed points do not all lie on the same line, they define a triangle. * Under a collineation, any line in the pencil of lines centered at one of the fixed points is mapped to another line in that pencil. * The point in which a line through a fixed point intersects the line of the opposite side of the triangle sets up a growth measure on that line. A growth measure is a sequence of points mapped one to the other by a projective transformation between two fixed points of the line. * When the two fixed points are located finitely, the sequence of points preserves a quantity known as the cross-ratio. If one of the points is located at infinity, the growth measure is a sequence of points in geometric progression, and the cross-ratio reduces to the ratio of the geometric sequence. * The boundary lines of the triangle are invariant, in the sense that any point on one of them is transformed by the collineation to another point on the same line, although not generally to the same point. This invariant triangle is the setting for a remarkable set of curves, known as path curves. We will describe in detail a limited case of path curves useful for characterizing the shapes of buds, based on the analysis of C. Almon [4]. Almon has shown that three-dimensional path curves can represented as the solutions to a set of linear homogeneous differential equations with constant coefficients in homogeneous coordinates. 3. Application of Path Curves to Computing Lambda Edwards chooses two of the three fixed
points of the projective transformation, O and V, to be finite,
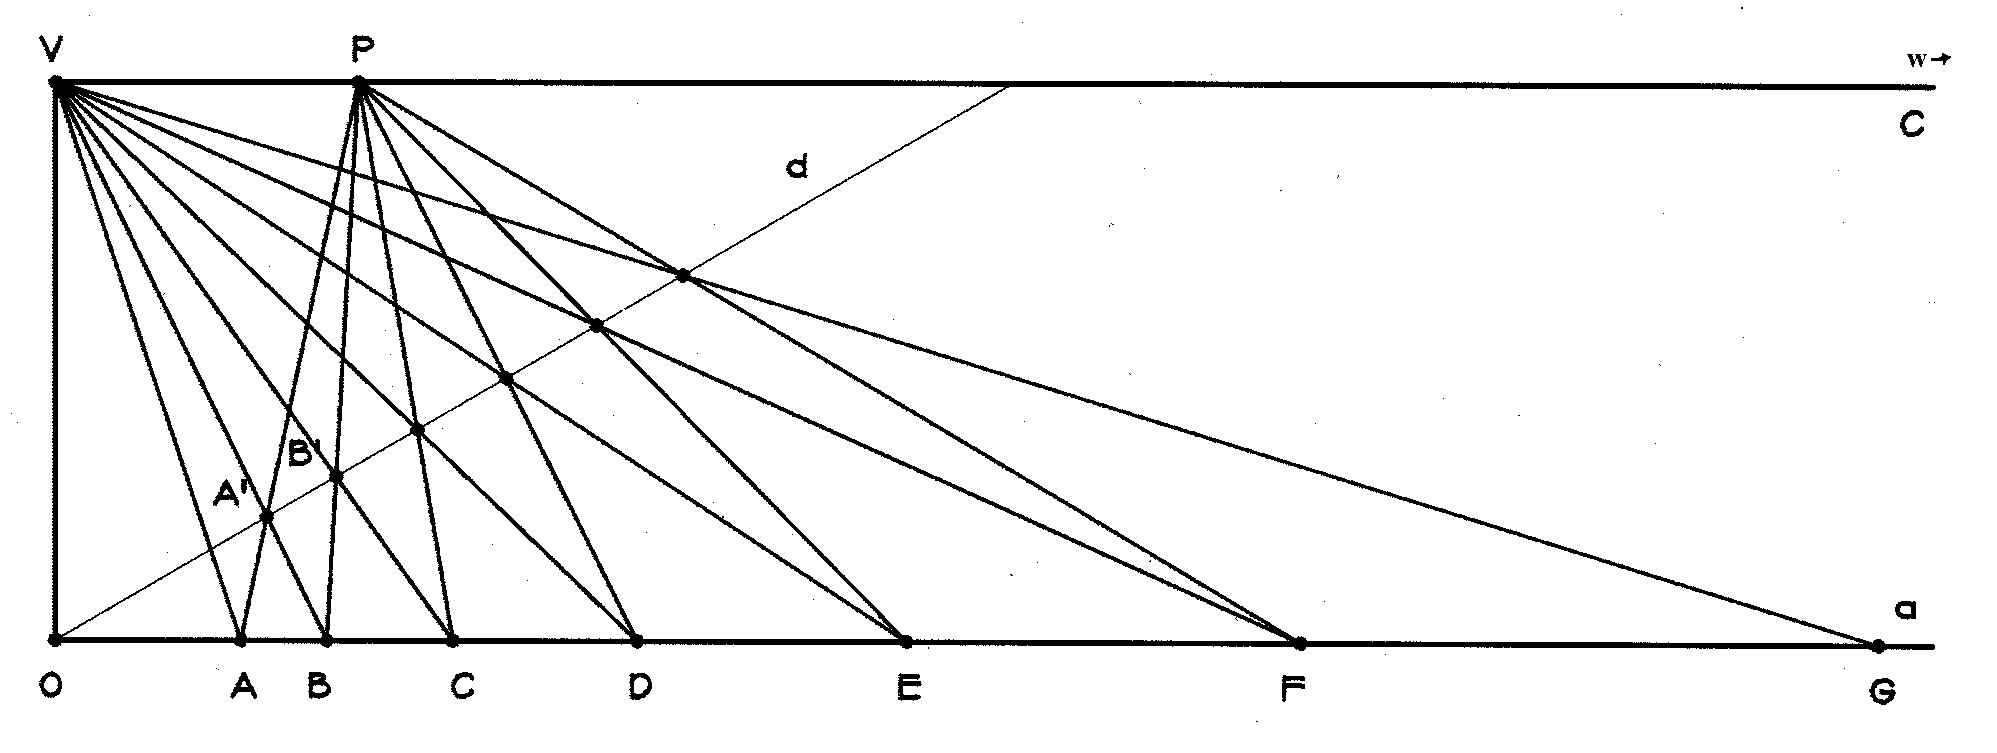
while the third point, W, is located at infinity, as seen in Figure
1. Lines a and c connecting O and V to
W are therefore parallel.
Figure 1: Construction of the bud-form curve. Drawing on the analysis of Almon, we plunge immediately into the construction of the bud-form curve. On line a pick points A and B as shown in Figure 1. Our first task is to find the point C on this line such that, OC/OB = OB/OA = l 1. This ratio expresses the cross-ratio when
W is the point at infinity on line a. That is to say, we are looking for
the point C that makes the distance from O grow by the same
percent between B and C as it did between A and B,
i.e., we are setting up a growth measure on a between fixed points
at O and W (at infinity). Draw line c parallel to a, and
choose V on c so that the line from V to O
will be perpendicular to c. Draw a line d passing through
O
and not identical with a. Draw VB and mark its intersection
with d by A'. Draw the line of AA' and mark its intersection
with c by P. Draw PB and mark its intersection with
d
by B'. Draw the line of VB' and mark its intersection with
a by C. C is the desired point. An expanding geometric
sequence of points A,B,C,D,E... can
be constructed on line a in this way. We say that l
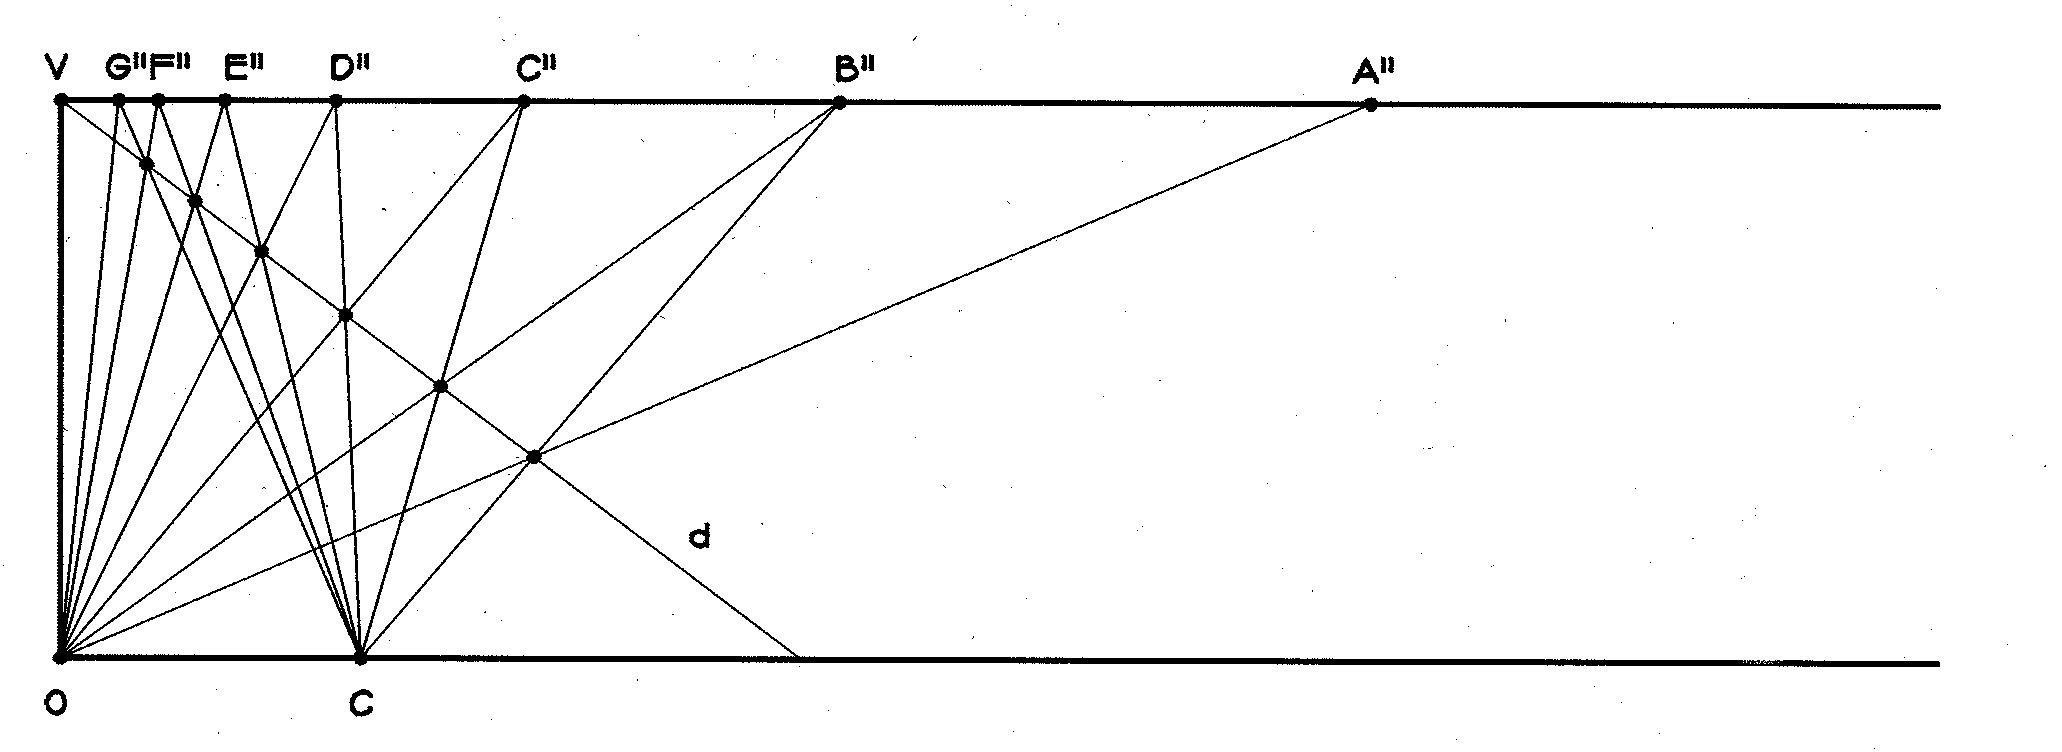
1 is the multiplier of this sequence. Similarly, in Figure
1 we construct a shrinking series of points A", B",C",
D",... along line c.
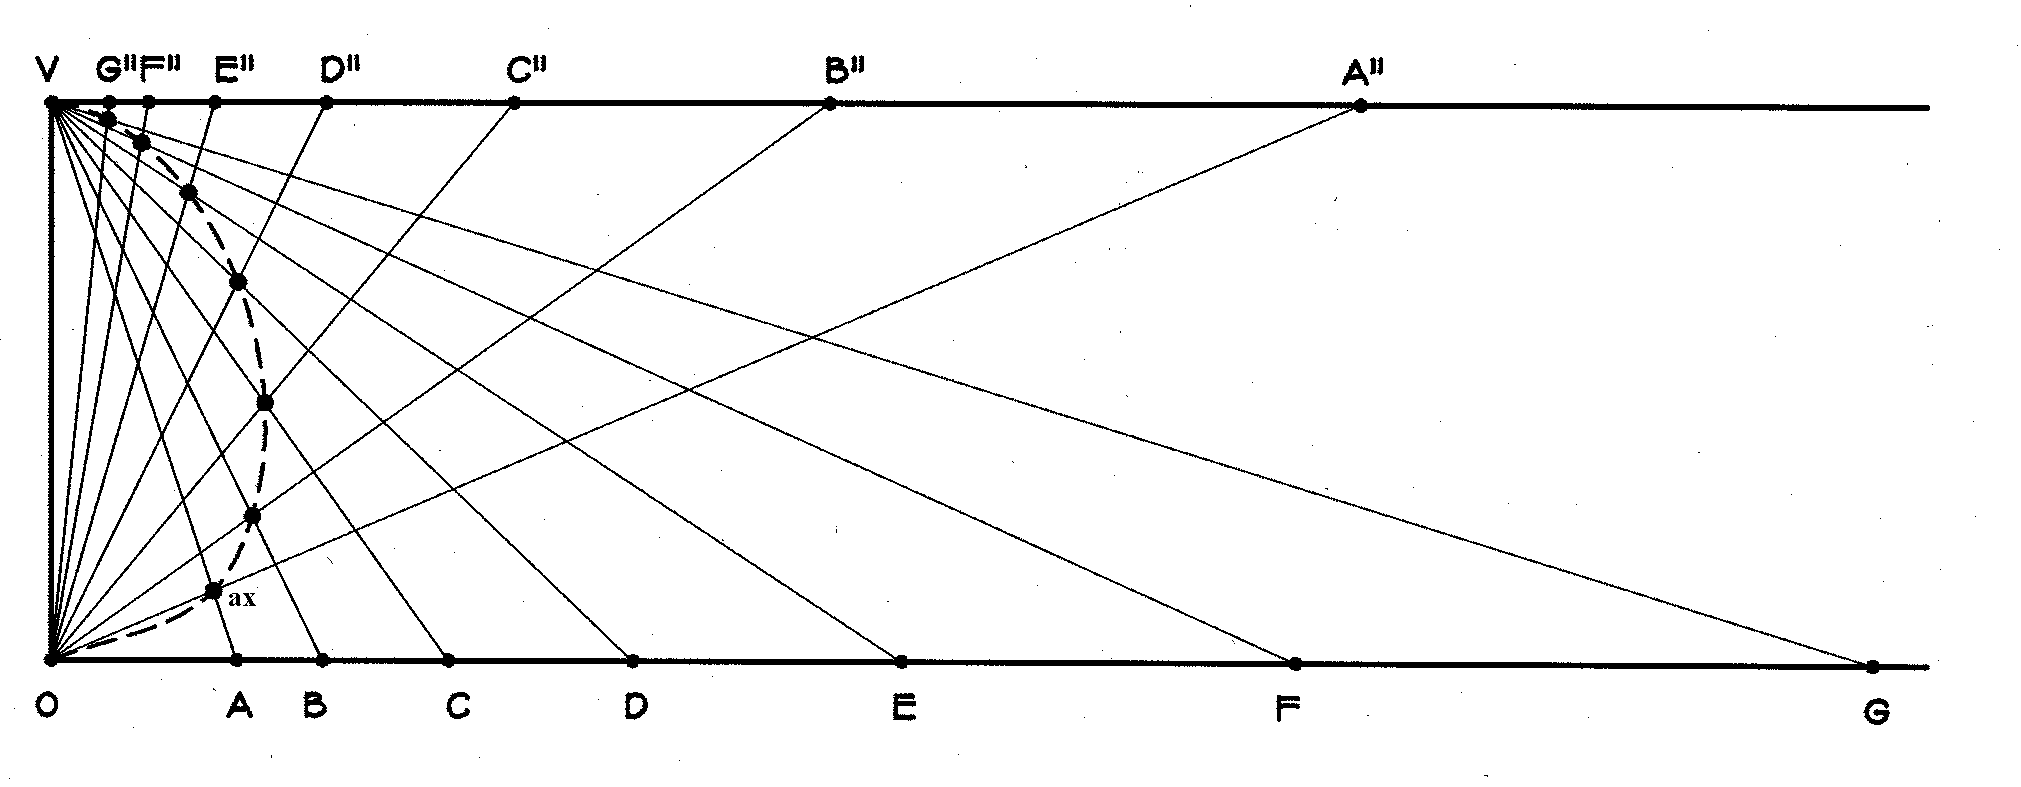
Figure 2: A shrinking series of points.. Let l 2 = VB"/VA" be the multiplier on c. Now, in Figure 3, we combine Figure 1 and Figure 2, but to avoid confusion we show only the lines passing through V and O. Where the line to A meets the line to A', mark the point x. Think now of x "stepping" along from line to line on the expanding sequence of lines and, simultaneously, on the contracting sequence. Its "footprints" will fall on the circled points of Figure 3.
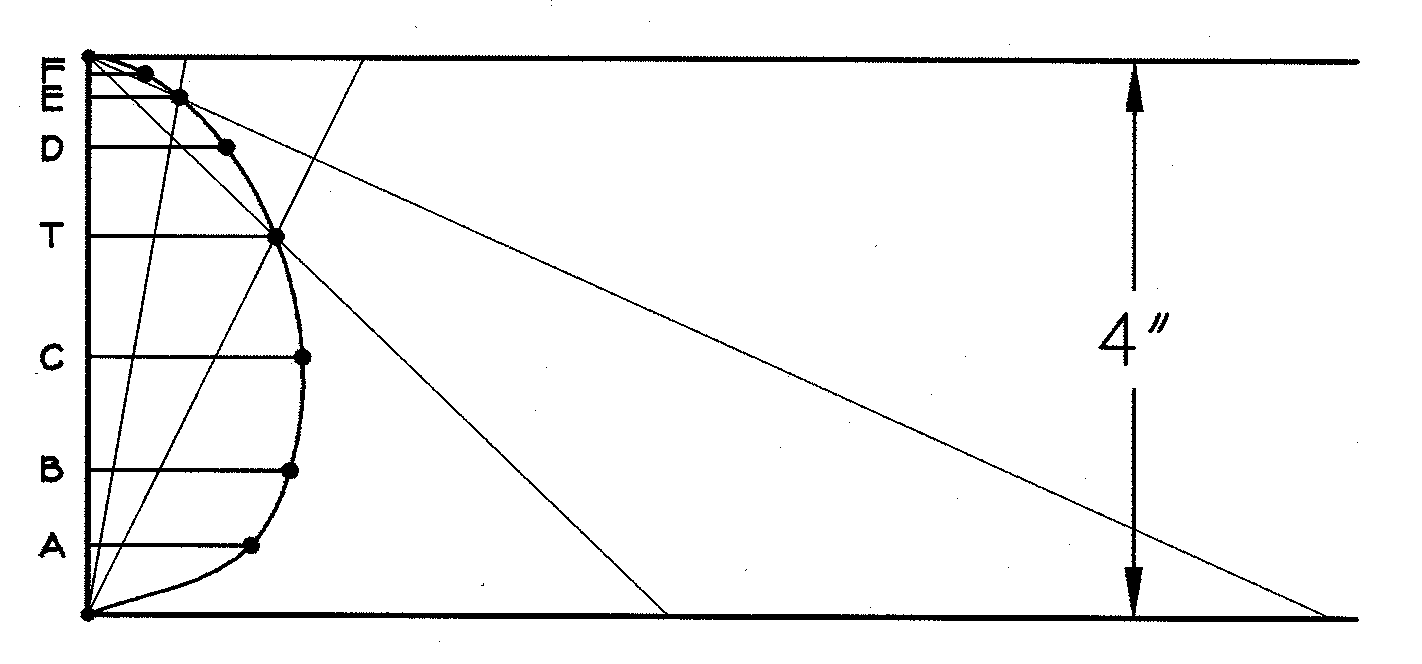
Figure 3: Figures 1 and 2 combined to create the bud shape as a path curve. Now suppose that, instead of having multiplier l 1 on a and multiplier l 2 on c we had multipliers of l 11/2 on a and l 21/2 on c. Then two steps of this "walk" are equivalent to one of the original. All of the "footprints" of x on the first walk remain footprints on the second, but the second has an extra point between each pair of the first. If we took a walk with l 11/3 on a and l 21/3 on c, then c would make two footprints between each pair of the original ones. With l 12/3 and l 22/3, x would have every other one of these footprints. Clearly c is traversing the same "path" on all of the walks; only its step-length differs. For all of the step-lengths, the ratio l = log l 2 /log l 1 = log Öl 2 /log Öl 1 remains the same and characterizes the path itself. Note that the exponential ratio is denoted by the unsubscripted symbol lambda (l ). At half-inch intervals along the vertical axis of the enlarged bud, Edwards measures the diameter. These measurements on at least seven buds of the species are averaged and plotted, as in Figure 4, to obtain one data point. Edwards then takes two points on the profile, say T and E in Figure 4, draws lines from O and V through them, and computes the multipliers l 1 and l 2 on lines a and c respectively. He then calculates
Figure 4: Plot of bud measurements after averaging. If the profile is a perfect path curve,
each pair of points gives the same value of lambda. For ease of computation,
Edwards takes the midpoint, marked T, in conjunction with each of
the other points. For fifty-five species and varieties, Edwards reports
the average absolute percentage deviations of the resulting six lambdas
from their mean [4]. He also indicates that a deviation
of ten percent or less means an extremely close fit to a path curve. Thirty
species had average deviations of less than 10 percent; twenty of them
had average deviations between 10 and 20 percent; four, between 20 and
30 percent; and only one over 30 percent.
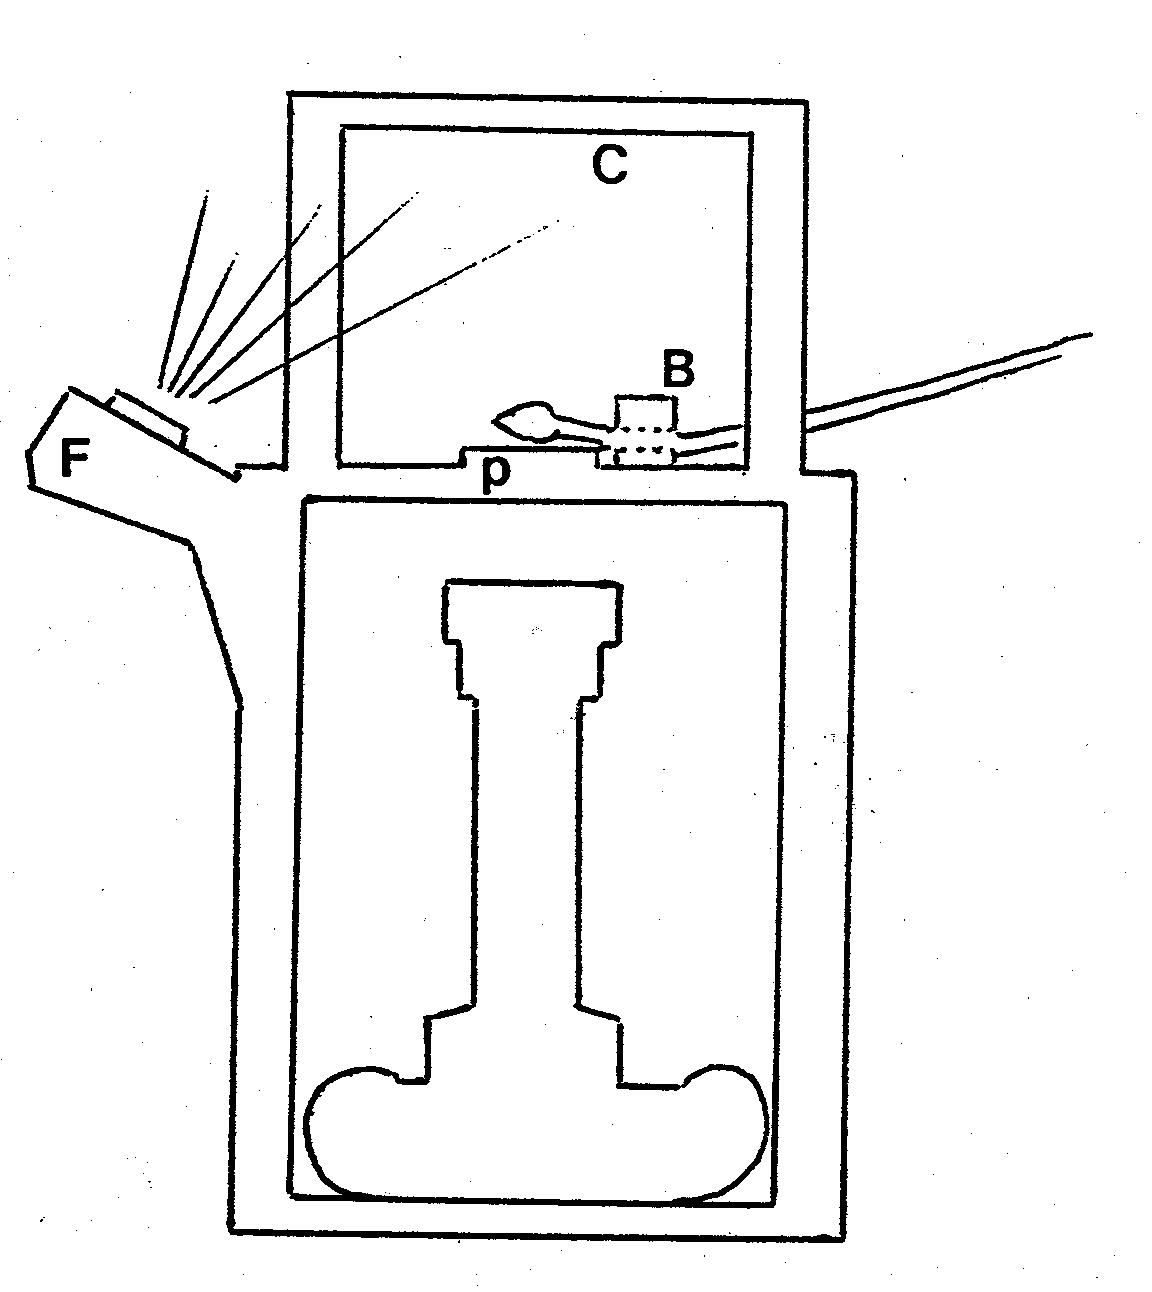
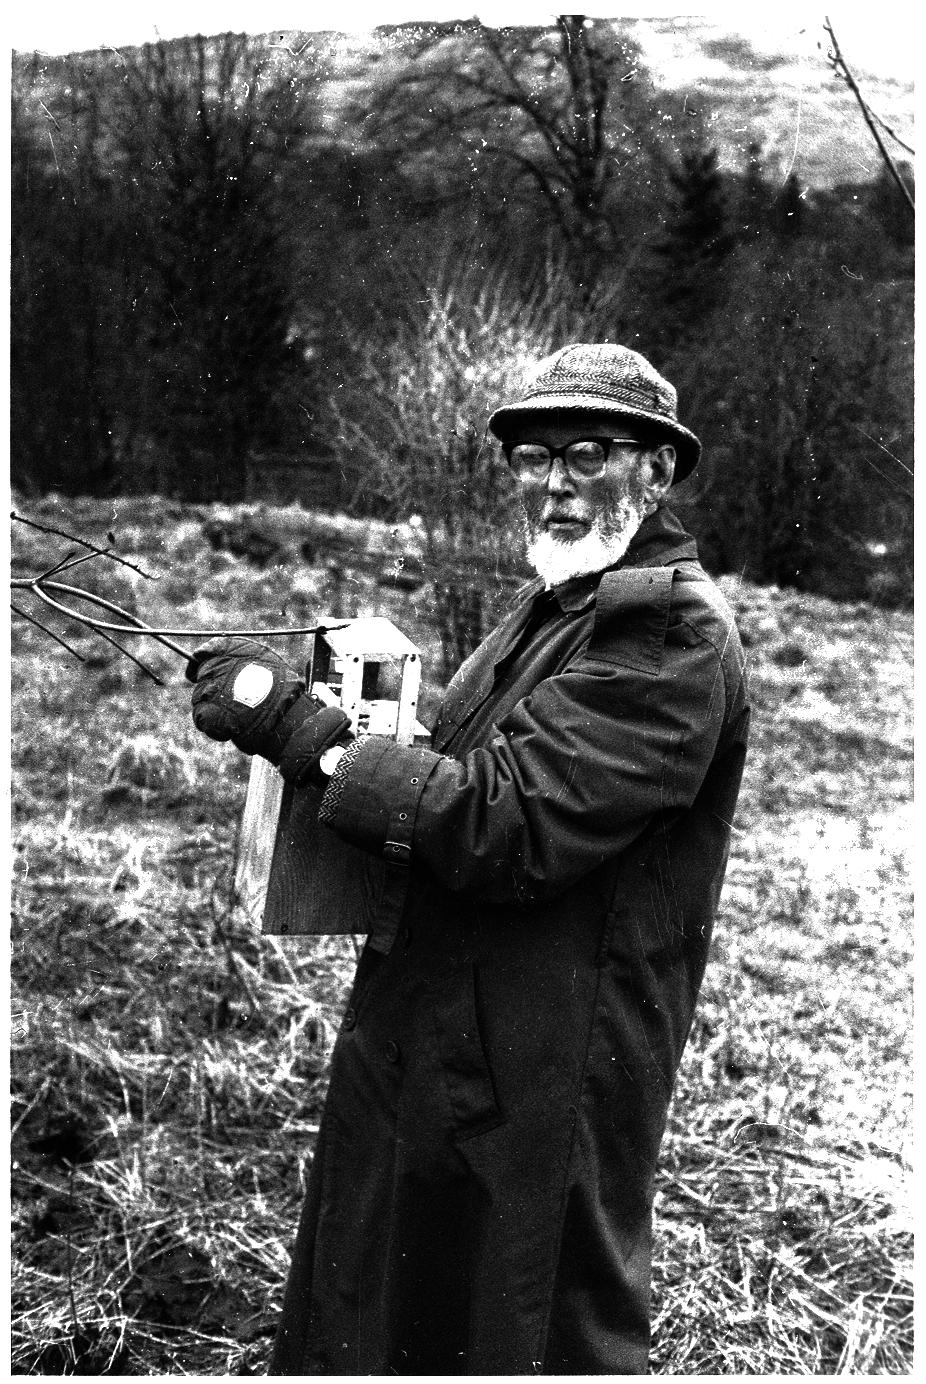
4. Experimental Procedure It is these path curves which Edwards has shown to give the profile of plant buds. For a particular species, he collects numerous buds at the point just before opening. Then, using tweezers and a magnifying glass, he carefully removes the outer petals and reveals the form of the inner inflorescence. If a tiny petal budges, the specimen is lost. At first Edwards relied solely on manual photographic methods. After 1987 he supplemented these manual methods by a fully automated bud measurement system including a video camera and computer generated bud measurements to record and analyze an image of the bud. In the manual procedure, he photographs the bud and then enlarges it to four inches in height. Edwards has developed sophisticated ways of sampling the buds, so that they are minimally disturbed while being measured. A diagram of his apparatus is shown in Figure 5. B is a wooden block with a small hole bored through it, just wide enough to allow the stem of the bud to pass through it. P is a perspex window, and F is a flash which illumines the white ceiling C. The bud, on its stem is passed through the hole in block B, and will be exactly in focus when it is just lying on the surface of the perspex window. This cannot guarantee that the bud will always be seen from exactly the same point of view, but Edwards has found that with care and practice a very considerable degree of uniformity in the selection of bud profile can be achieved. The photo can then be taken without removing the bud from its branch. Edwards also insists that a single individual take and analyze a given series of bud photographs in order to maximize the internal consistency of the results. Figure 6 shows Edwards photographing a bud using this apparatus equipped an accurate camera with a Zeiss lens.
Figure 6: Lawrence Edwards measuring a bud. In 1987, with the help of a grant from the Margaret Wilkinson Research Fund, Edwards began to use an electronic scanner which eliminates the necessity for photography. According to Edwards, "This remarkable machine not only does all one’s
calculations but also makes the measurements on which they are based. It
consists of a computer with a wide range of memory, an extra monitor screen
and a T.V. camera. When the buds, mounted on their glass measuring plate,
are put into the machine, an enlarged image of them appears on the monitor
screen, and from there a message is sent to the computer giving firstly
x, y-coordinates (as seen on the computer screen) of the tip of the bud,
then of the base of the bud, and thereafter of the left- and right-hand
ends of each diameter, working from the base end upwards. This data goes
into a fresh file for each bud. The computer program then goes from file
to file picking up all the data, converts coordinate pairs into distances
(i.e., levels upwards from the base to the tip, and diameters at each of
these levels), finds from these the dimensions of the mean bud of the whole
set, and delivers its lambda, calculated according to the original projective
method and using statistical methods of linear regression."
The results of the electronic scanner were entirely
consistent with the manual method. However now 20 buds could be analyzed
in the same time as one bud was previously analyzed. In 1991 a second machine
was purchased. At about the same time Graham Calderwood, of Camphill, Aberdeen
completed construction of a third machine so that since 1992 results have
been obtained from three independent observers separated by 500 miles of
countryside.
5. Fourteen Day Rhythms of Buds For the past seventeen years Edwards has
devoted most of his time to a discovery that buds subtly change their shape
every fourteen days. His studies are based on more than 50,000 measurements
and show that these changes can be correlated with lambda. Edwards’s data
appears to suggest that these shape changes are correlated with the changing
positions of the moon and that the fourteen day cycle is particular to
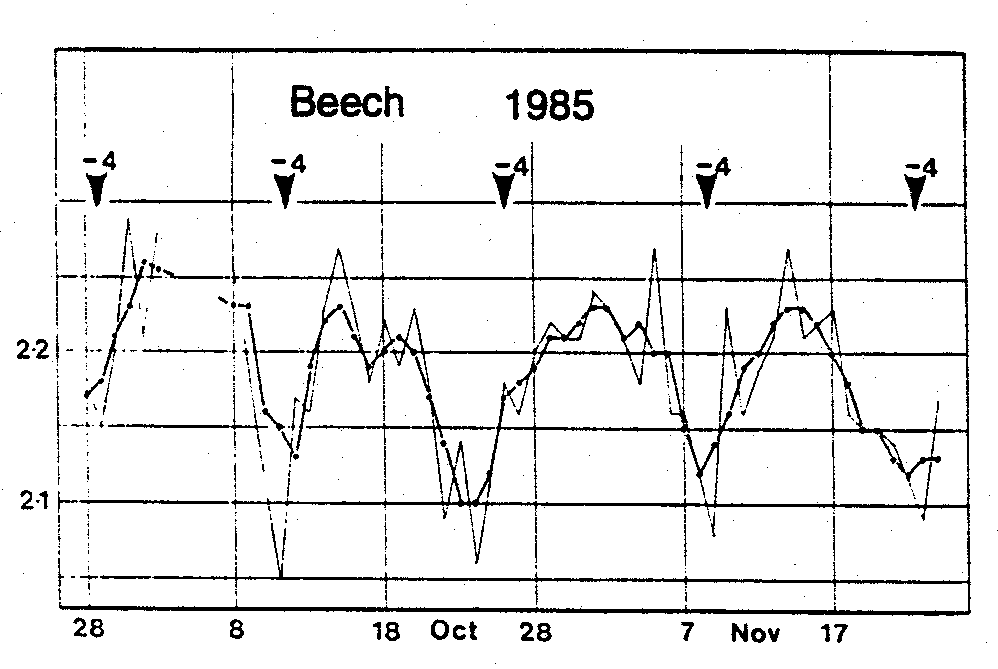
each species of bud [1]. Figure 7 shows
lambda values plotted against time for beech tree buds taken in 1985.
Figure 7: Mean l-
values for Beech leaf buds, autumn 1985, with phase- shift form
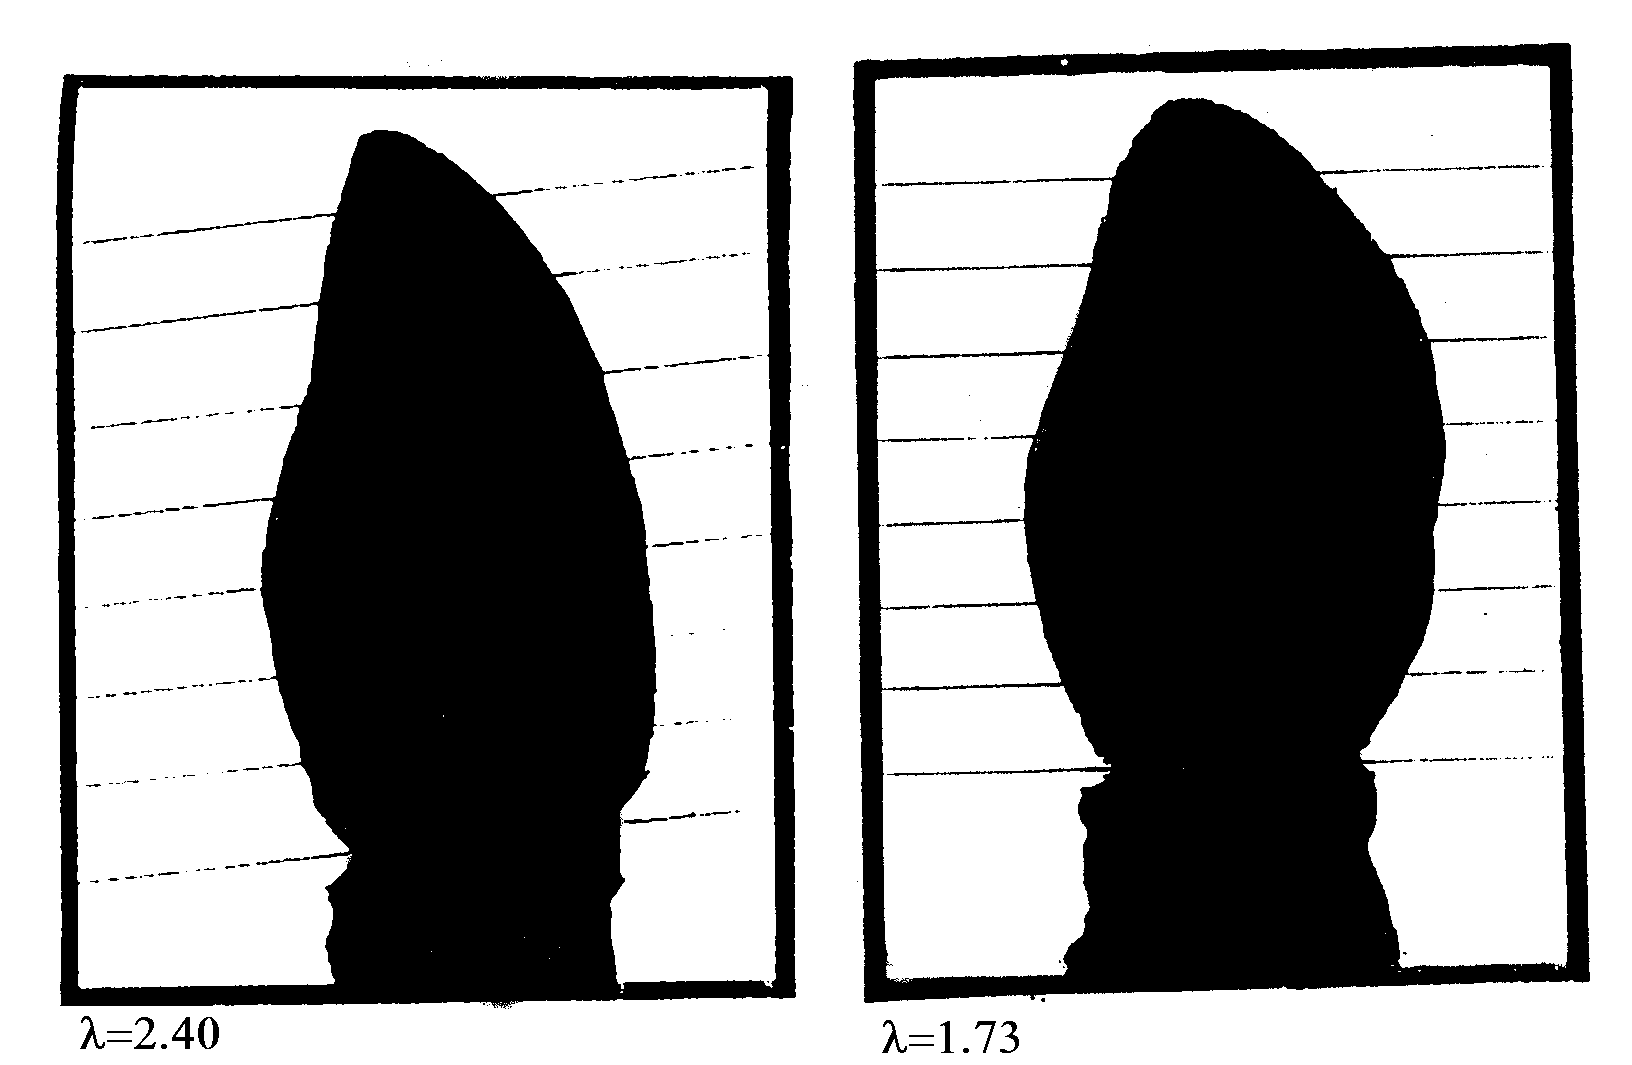
The lightly drawn jagged curve shows daily results while the smoother heavily drawn curve averages the daily results on three successive days. Notice that the lambda value drops below 2.1 at approximately 14-day intervals. In other words, each fortnight the plant makes a small "gesture" registered by a dip (or for some species of bud, an increase) in lambda. This reflects a slight change in shape of the bud so that its tip goes either from more rounded to more sharp or vice versa. The left picture of Figure 8 shows a birch bud at a normal state, sharper at its tip; the right picture shows the same bud at the time of its minimum value of lambda, in a more rounded state.
Figure 8: A slight change
in shape of the bud.
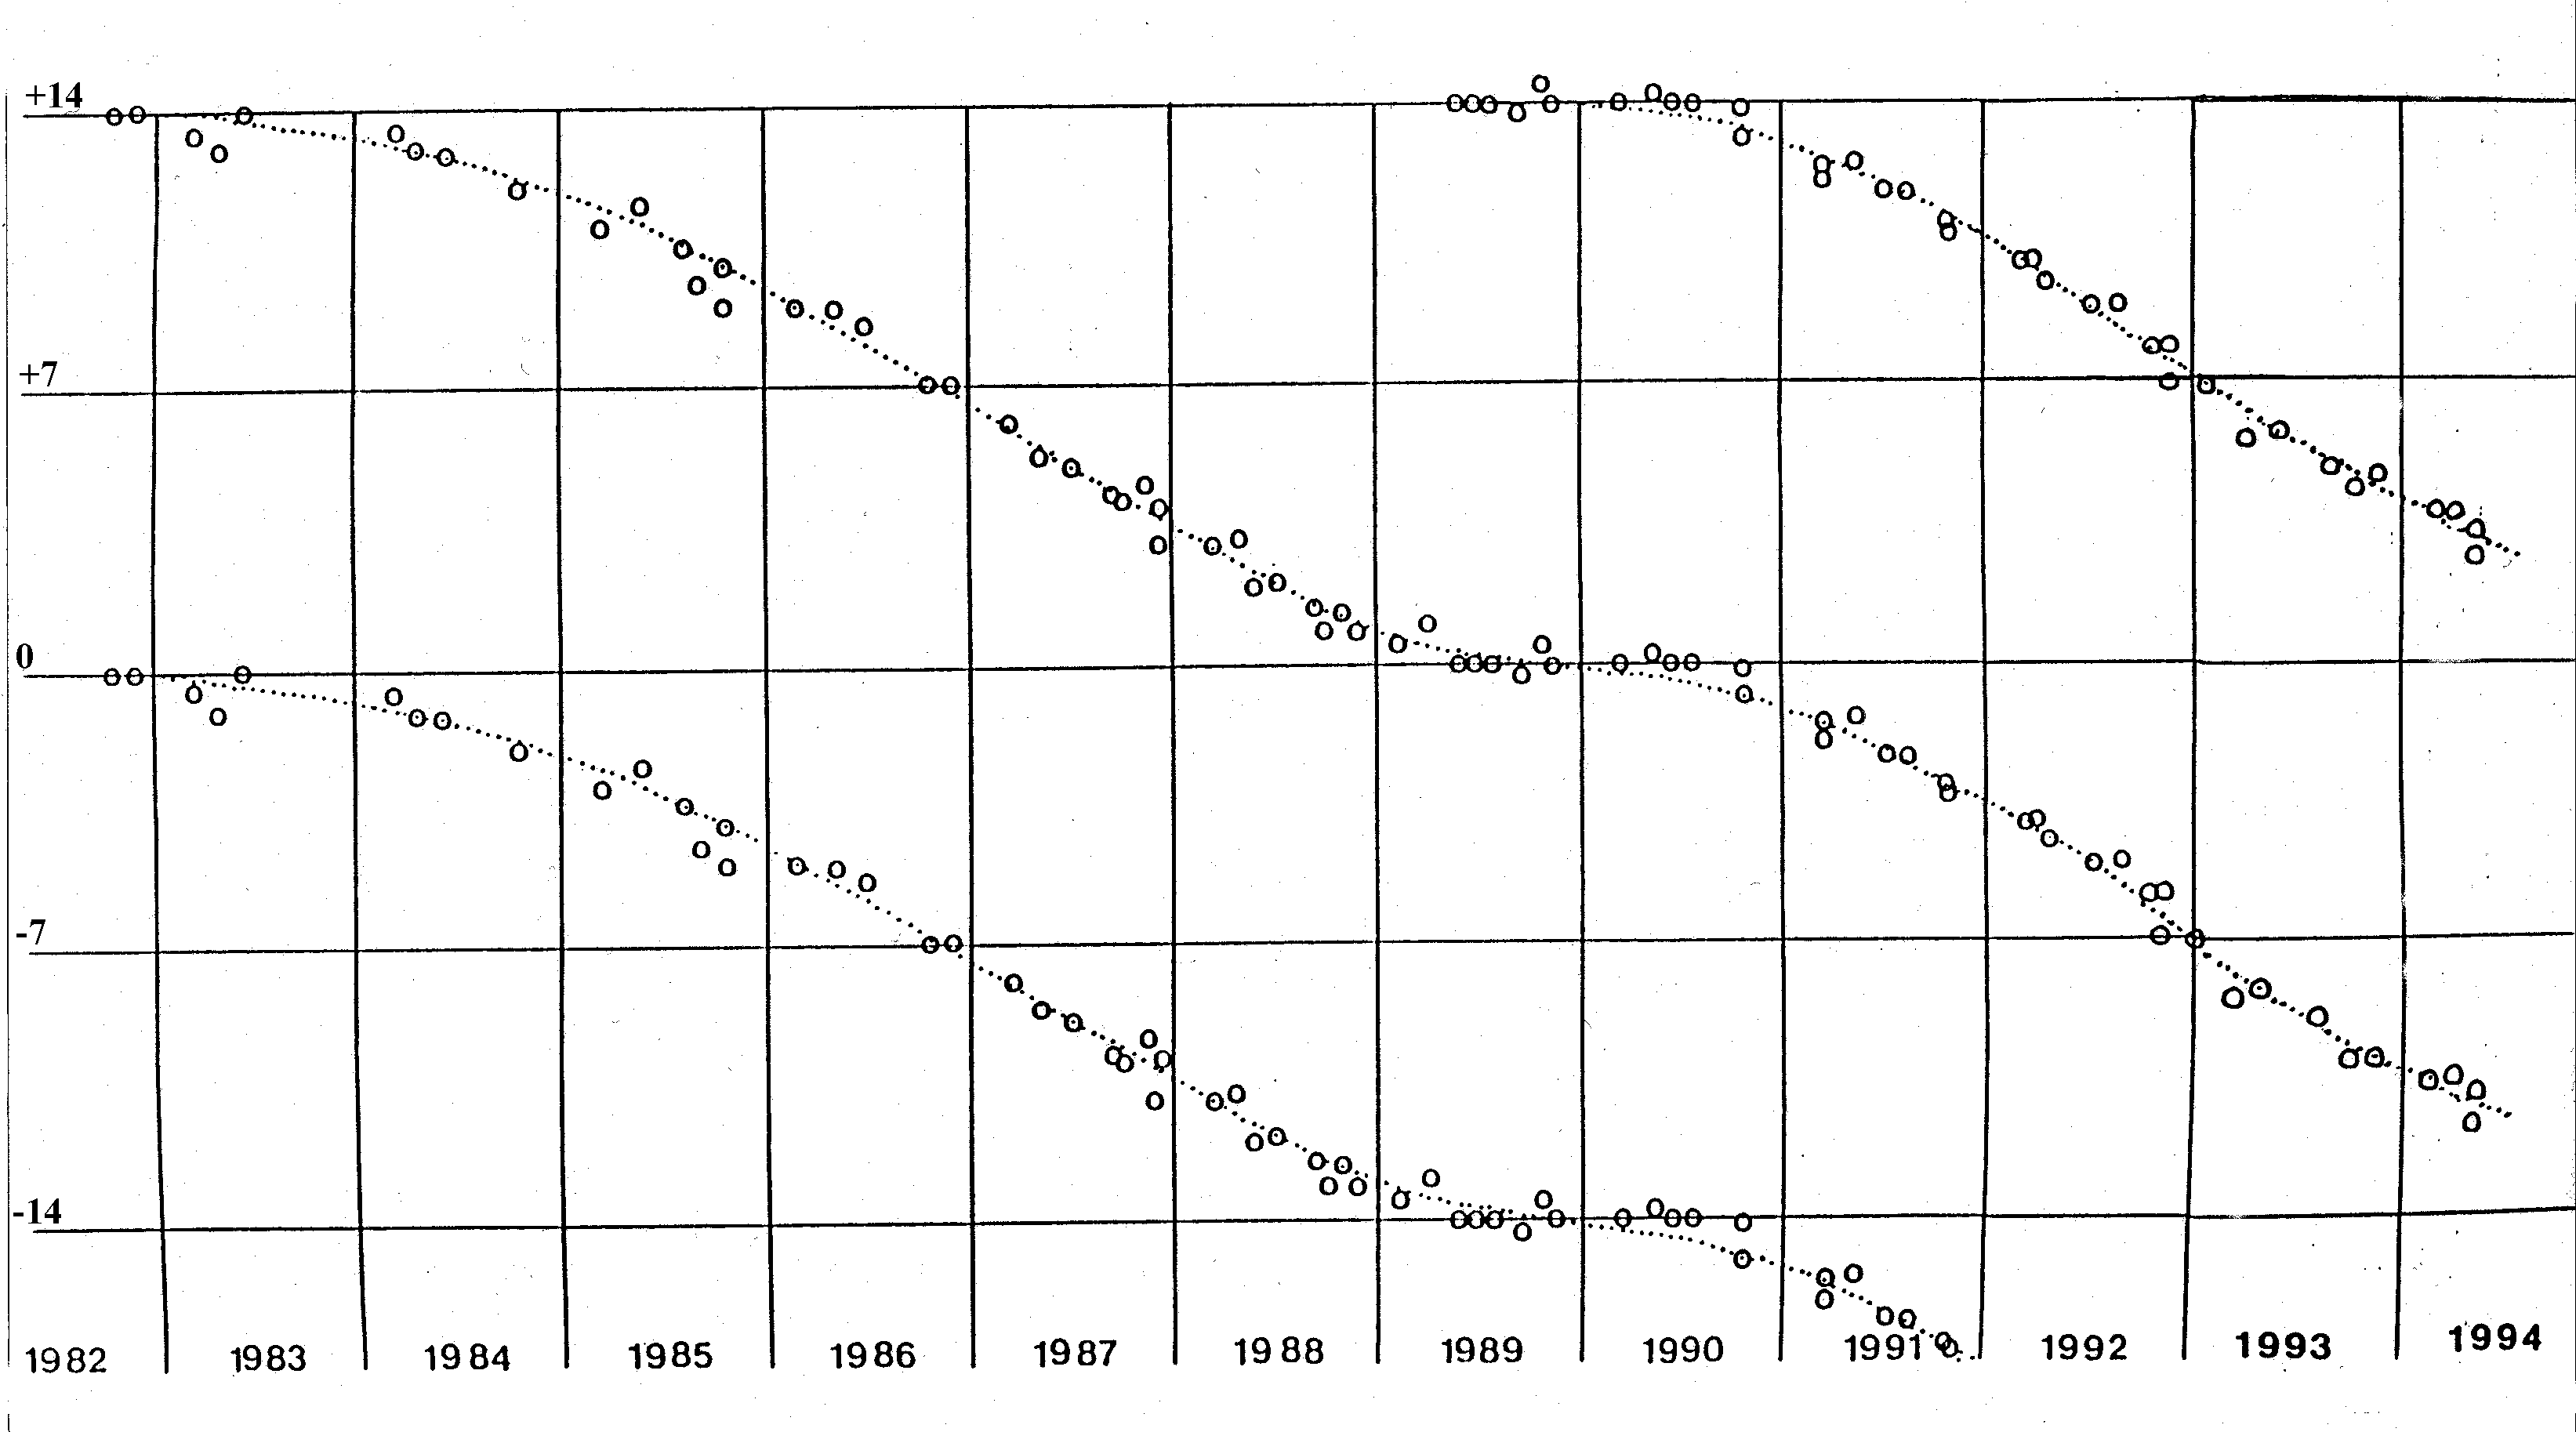
6. Seven year rhythms correlated with planets Edwards observed these fourteen day rhythms over a period of twelve years and made the obvious hypothesis that they correlated with a lunar cycle. However, he then began to investigate whether there were other astronomical correlations. He discovered that the time of maximum expression correlated with a different planet depending on the species of bud. For example, notice the arrows in Figure 7. They indicate that in 1985 Beech leaf buds achieved their time of maximum shape change four days prior to the alignment of the Earth, the moon and Saturn. In fact he discovered that once every seven years the maximum gesture occurs exactly at alignment of Earth, Moon and planet, but each year thereafter the time of alignment occurs prior to alignment by –1, –2, –3,…, –7 days until after seven years they are back in alignment. Thereafter the maximum occurs after alignment by +1,+2,+3,…,+7 days until after seven more years they are again back in alignment. In other words superimposed over the 14-day cycle is another cycle of seven years. This chart of phase shifts for several species of bud is shown in Figure 9 where the phase shifts of –1, –2, –3,…, –7,0,+1,+2,+3,…,+7 are plotted against time in years for the period 1982-1992. Similar correlations are borne out by other species of buds. For example the oak correlates with Mars, the Knapweed and Birch with Jupiter, and the Ash with the Sun. Once Edwards understood the nature of the phase time,
this information could be used to relate all of the data taken over his
twelve years of sampling, a total of thousands of points by relating them
back to a common datum. This would have the effect of smoothing out the
curves. After all there are numerous factors that interfere with measurements
of the 14-day cycles: idiosyncracies of weather, physical differences among
buds, and small variations in sampling technique. However, over the course
of many years, all of these extraneous variations would tend to cancel
leaving the plant gesture to express itself more purely, and this is exactly
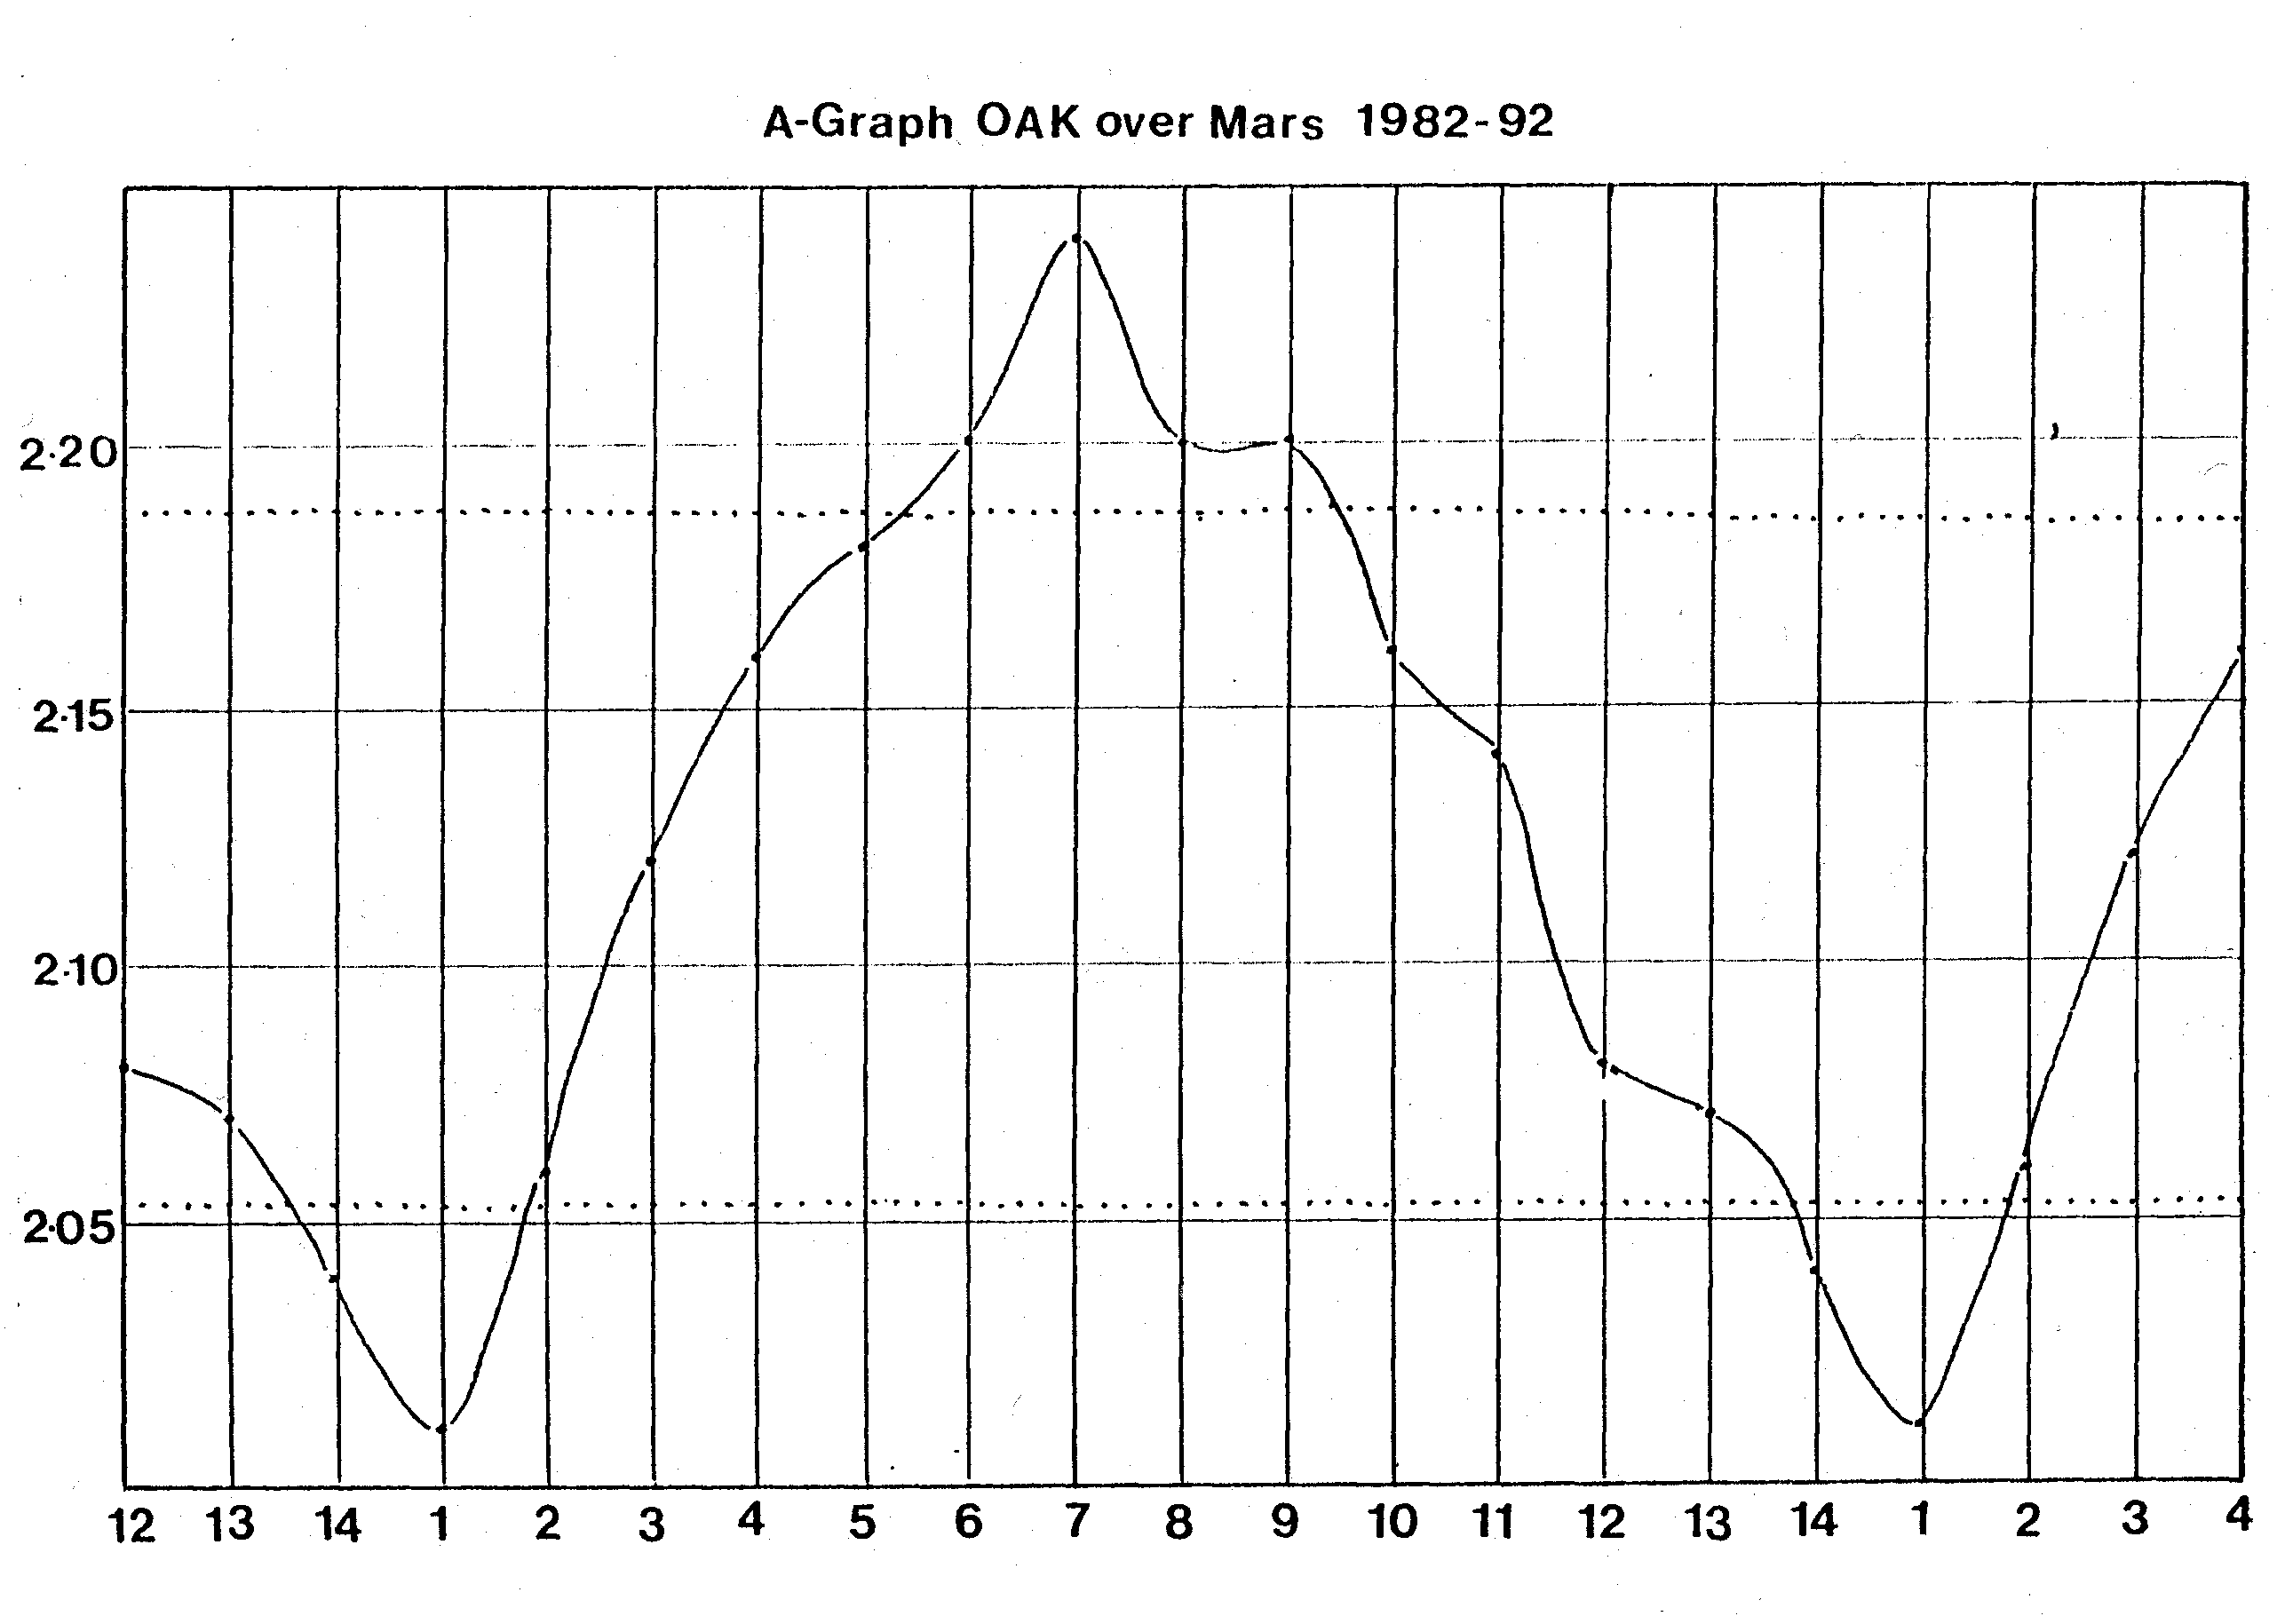
what happened. Figure 10 shows the rotation locked
averages (aggregate graph) of oak buds taken over the years from 1982
to 1992.
Figure 10: Averaged l- values vs time for the graph of Oak over Mars for the years 1982-1992. The dotted lines indicate the limits of three standard deviations from the mean value. Any variations outside these limits have statistical significance, and the values at the beginning and end of the cycles, representing the time of the bud gestures, are two such variations. Graphs such as these were made for various species of bud each correlated with its own planet. Each showed a similar effect. This work is entirely empirical, and no mechanism has been suggested to explain the results. It should be noted that the Knapweed tree
sitting beneath the one power line within Edwards’ village of Strontian
does not exhibit the 14-day cycle. Edwards has also found that when two
planets are aligned, the buds that correlate with these planets lose their
14-day rhythms for a period of time. Edwards refers to these buds as having
an elevated "temperature" or suffering from a "fever" at these times. For
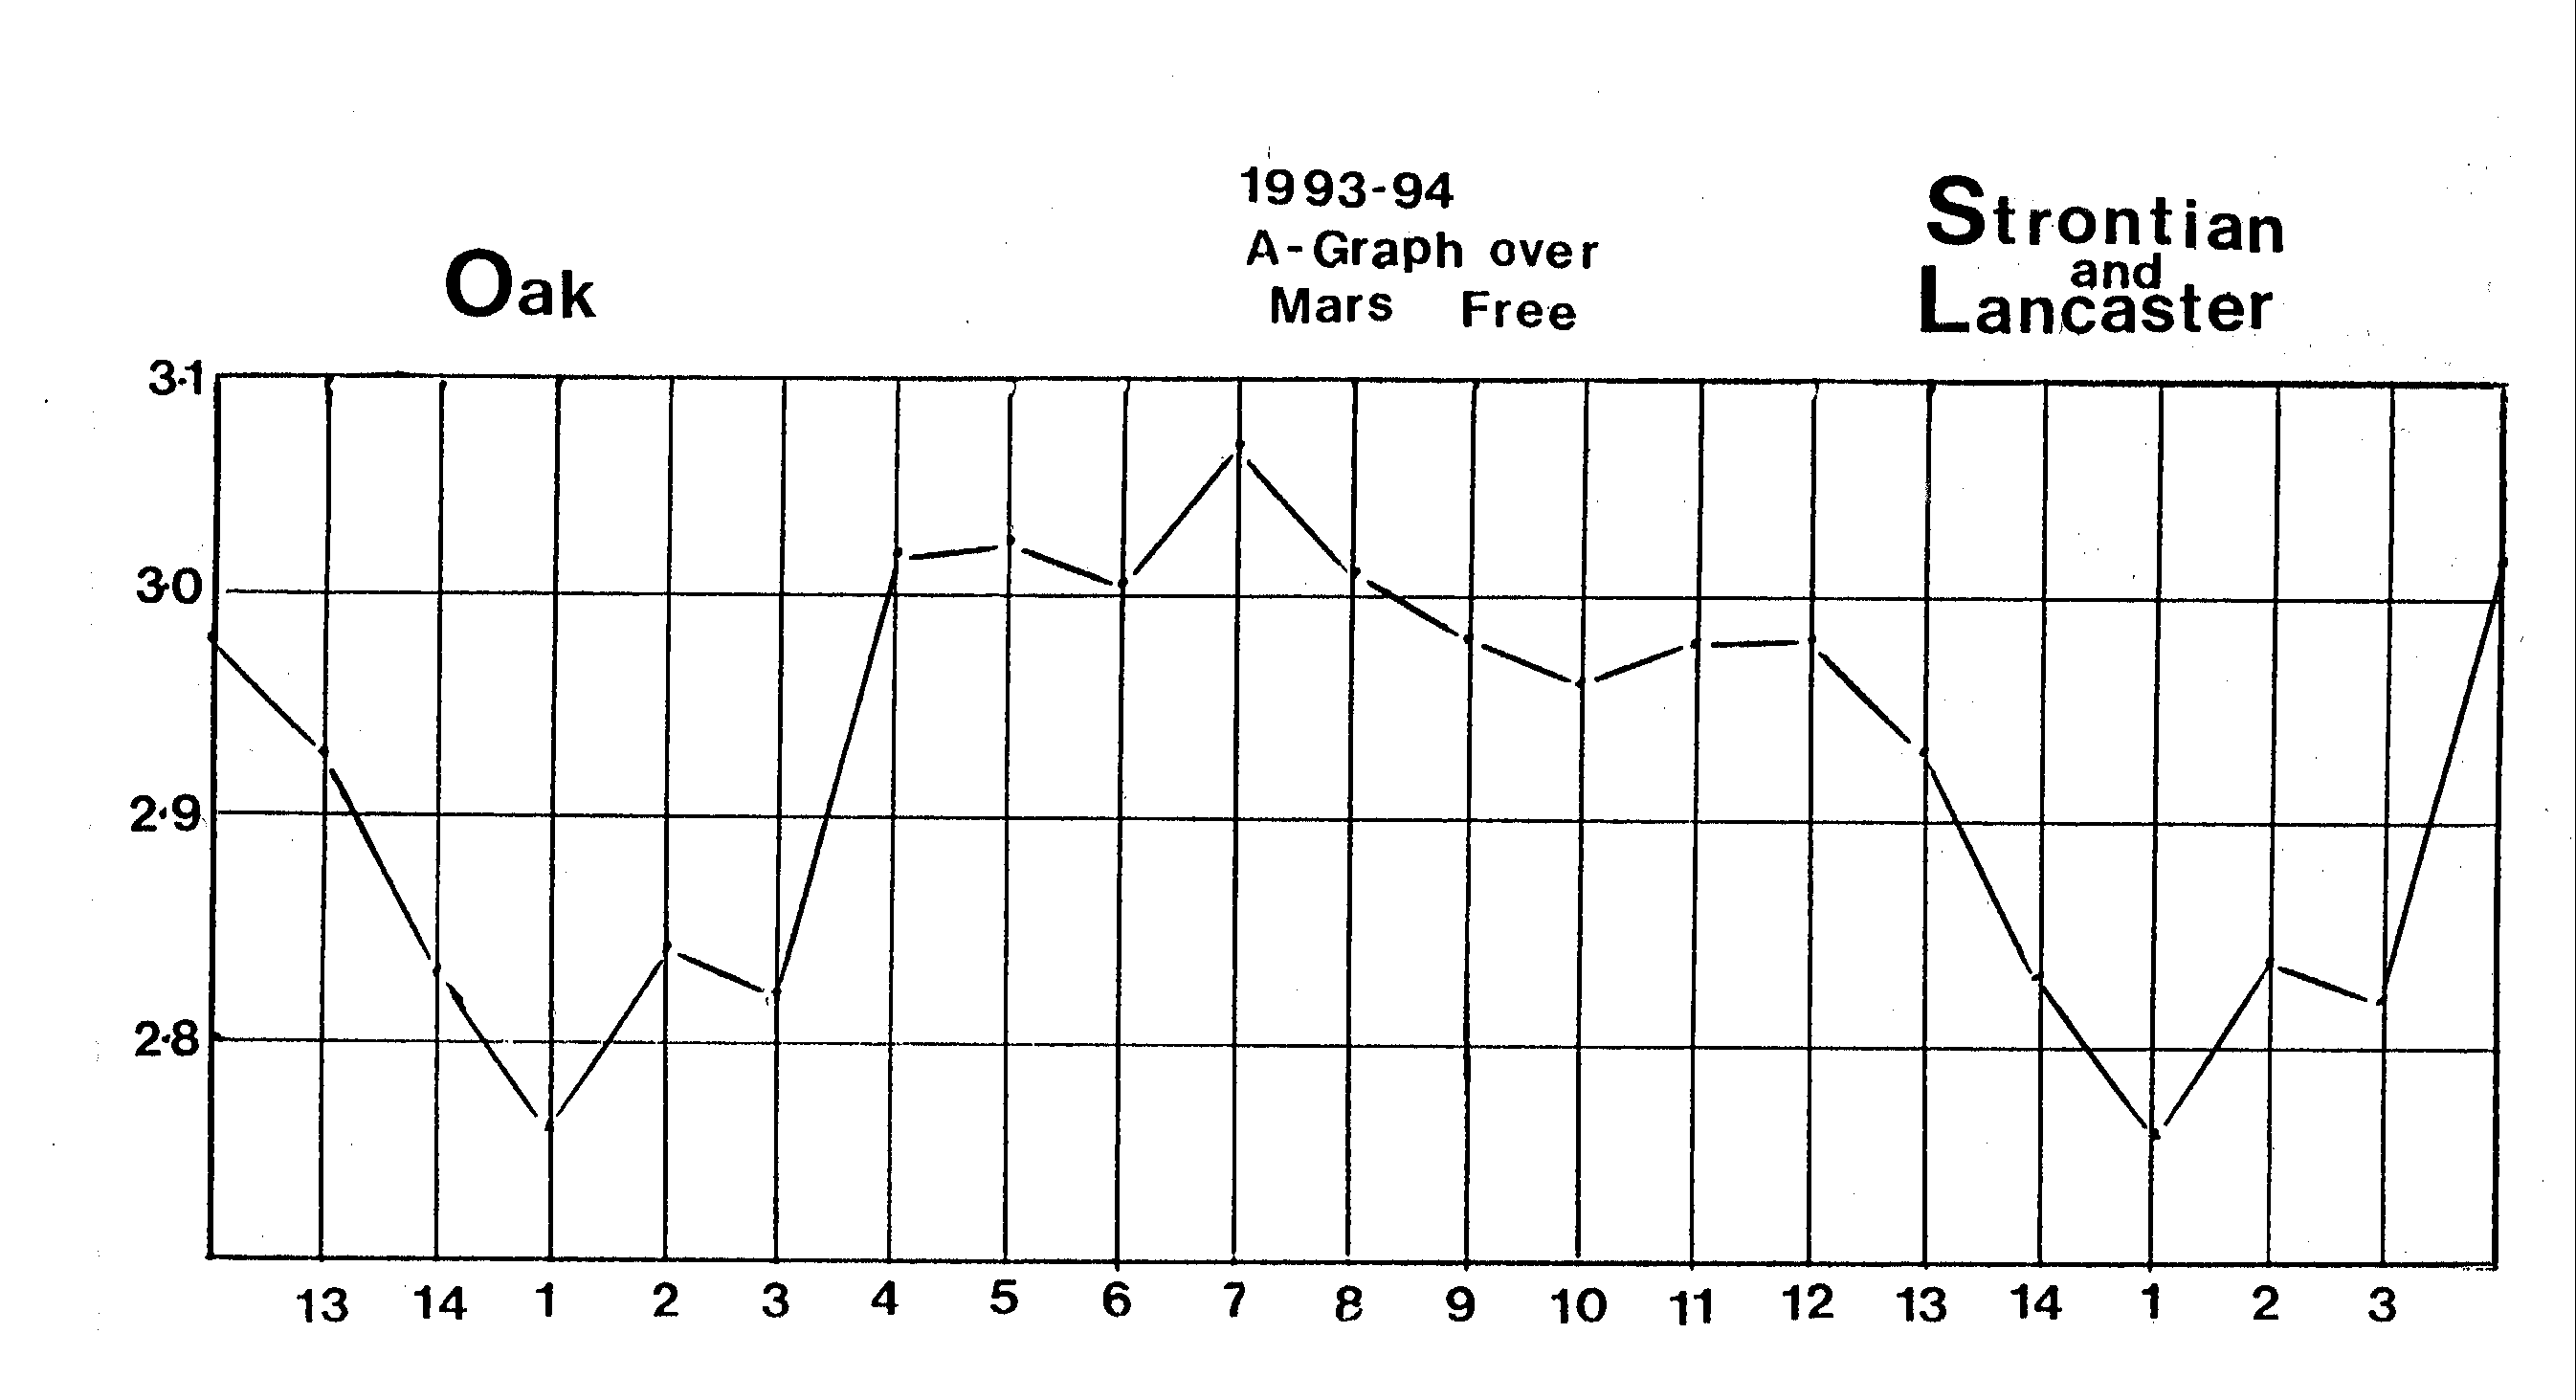
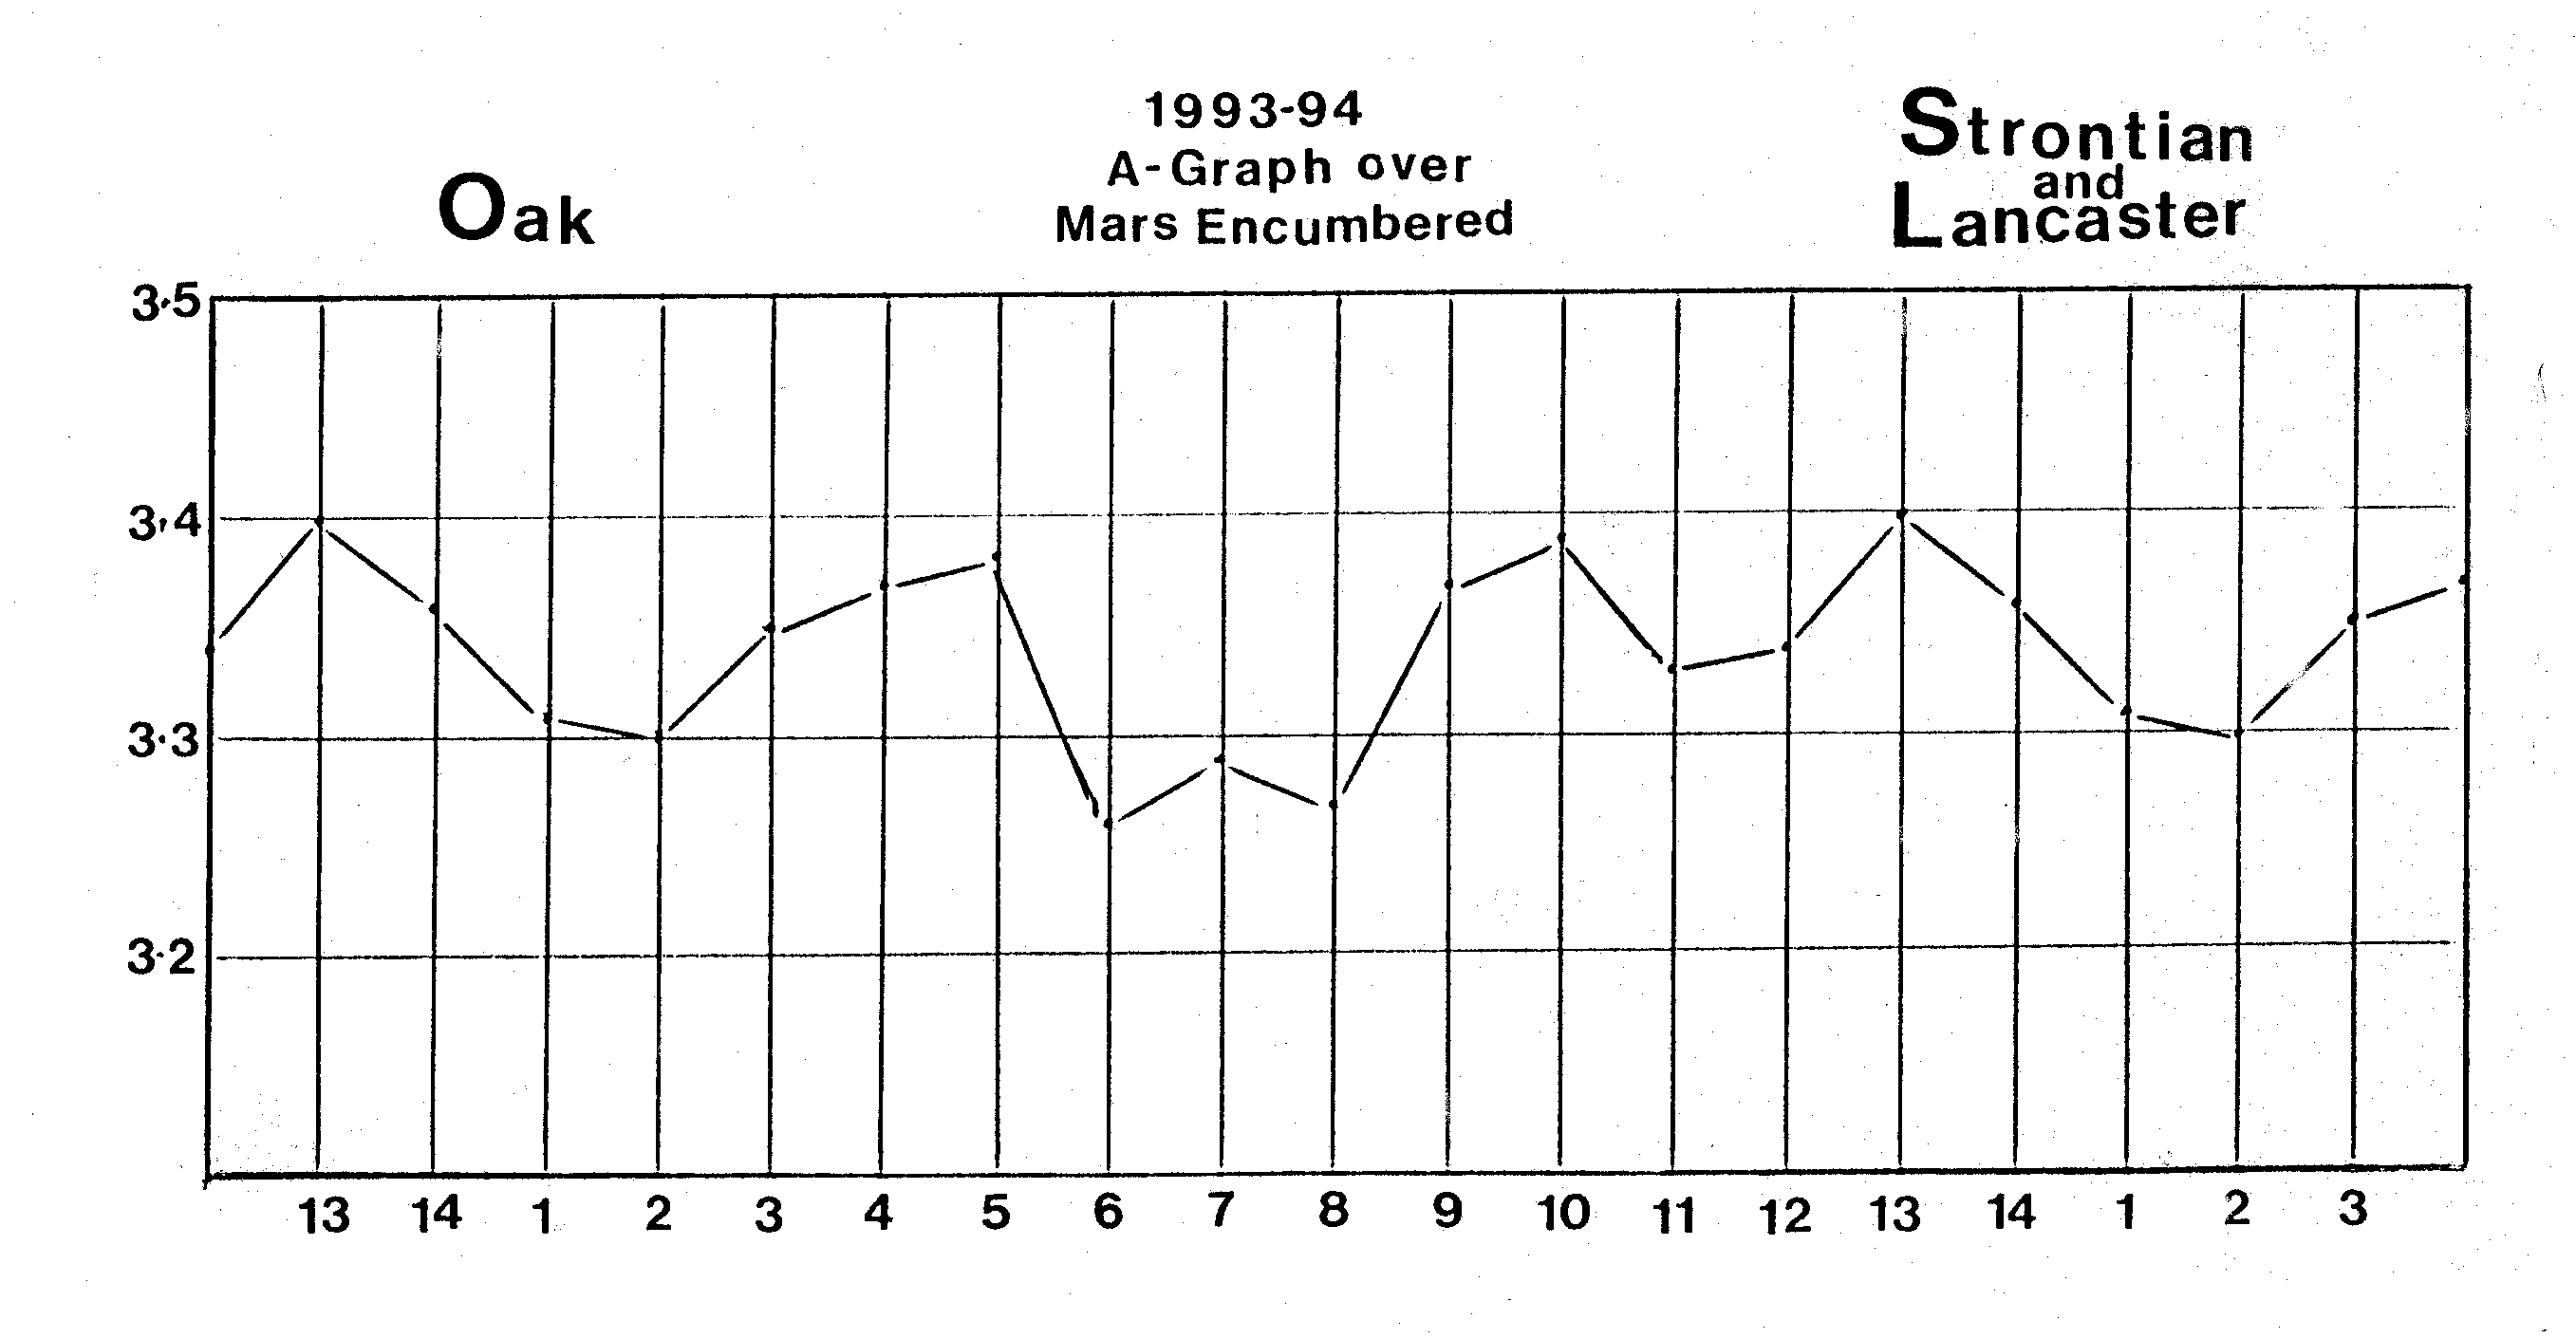
example, in 1993 the oak, correlated with Mars, exhibits its fourten day
rhythm in Figure 11a, whereas those rhythms are lost
in Figure 11b when Mars was encumbered by an allignment
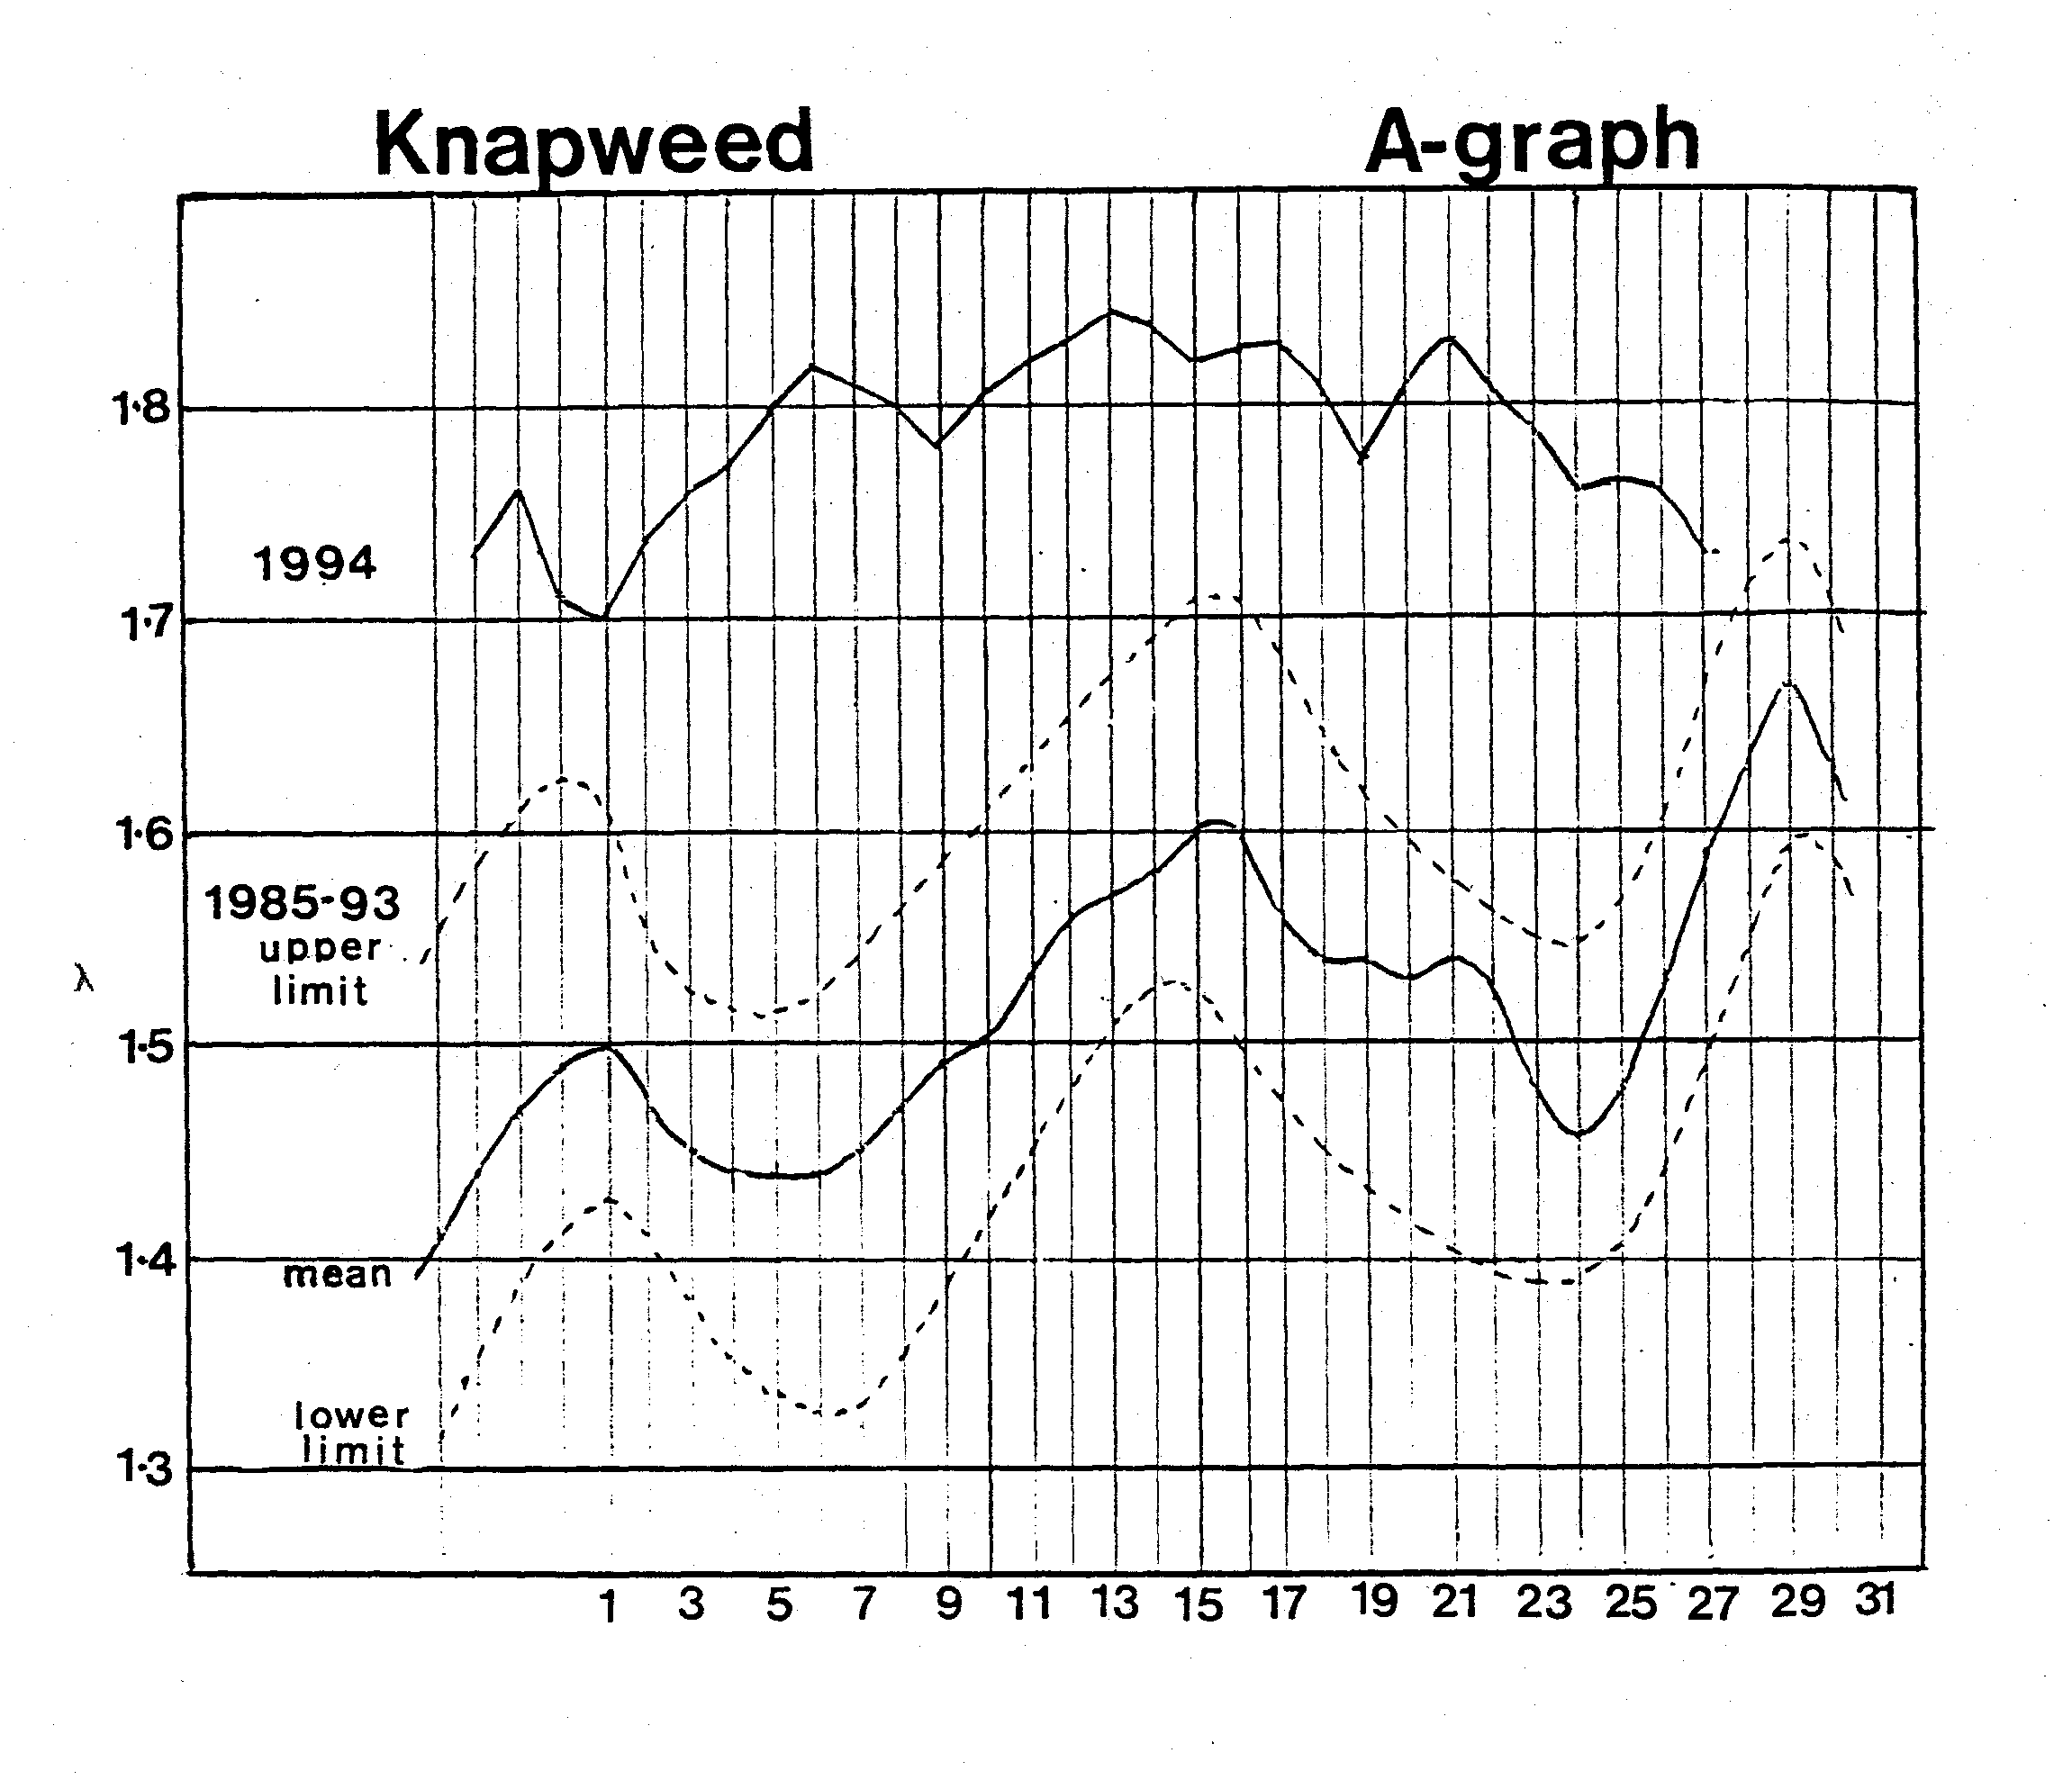
with Saturn. Perhaps more astounding is his observation of the effect of
the meteor that struck Jupiter in 1994. The fourteen day rhythms of the
Knapweed buds were thrown two standard deviations above their eight year
average values for a period of three months and lost their cycles before
they began to return to their fourteen day cycles as shown in Figure
12.
Figure 11a: Fourteen day rhythm of oak corallated with Mars.
Figure 11b: Fourteen day rhythm destroyed by conjuction of Mars with Saturn. Edwards’s results of fourteen day cycles
are consistent with data of long term (more than 2 million years) fossil
records found on the ocean floor. The waxing and waning of these fossil
records also occur in cycles that are correlated with lunar and planetary
movements as well as cycles governing the precession of the earth’s axis,
its tilt with respect to the plane of the Earth’s movement, and another
lengthy cycle of changes in the eccentricity of the orbit of the Earth
about the sun. These are linked to alignments between the Earth, the moon,
and other planets perhaps in a similar sense to the correlations that Edwards
has demonstrated in his bud work. The data also appears to indicate, that
as for Edwards’s data, there does not appear to be a cause and effect relationship
between the various correlations [5,6].
Figure 12 Edwards’s results have been confirmed by Graham Calderwood of Camphill and two other observers in England and by John Blackwood in Sydney, Australia. The results of Australia appear to indicate that the phase shifts have the opposite parity as one might expect from its situation on the opposite side of the globe. 7. Conclusions Edwards’s work indicates that the atmosphere, oceans and rivers, and the biosphere may serve as a sensitive membrane that mediates between heaven and earth. Buds participate as part of this membrane and may even be capable of transmitting information to Earth concerning the state of the lunar and planetary environment. Projective geometry may provide the means to interpret this information. The work is entirely empirical and shows a correspondence between lunar and planetary motion and the dynamics of buds rather than a biological mechanism. However, before Edwards’s work can be accepted as being scientifically valid, it will have to be corroborated by other researchers. This paper is meant to be an invitation to others to further explore these phenomena.
References [1] L. Edwards, Projective Geometry, London: Rudolph Steiner Inst., 1985. [2] L. Edwards, The Vortex of Life. Volumes 1,2, and 3. London: Floris Books, 1993. [3] J. Kappraff,. Beyond Measure: A Guided Tour though Nature, Myth, and Number, Singapore: World Scientific, 2002 [4] C. Almon, Path Curves and Plant Buds: An Introduction to the Work of Lawrence Edwards, Unpublished monograph, 1979. [5] T.M. Cronin and M.E. Raymo, "Orbital forcing of deep-sea benthic species diversity," Nature v 385, pp 624-627, 1997. [6] C. Charles, "Cool tropical punch of the ice ages," Nature v 385 pp 681-682, 1997 |
