2.3. A parenthetic note on non-linearity
It is well known that chaos needs non-linearity. This aspect could seem too specific to be discussed with reference to Klee’s paintings, drawings and writings. Yet I will present a few examples, just to stress that Klee also guessed something interesting about that: indeed he did know that growth processes are non-linear.
The first example deals with plant growth. In a pedagogical sketch
[21] Klee schematically describes the branching process: starting from the trunk, for each new ramification level the branches are reduced in both the length and the thickness, according to a progression of odd numbers, explicitly written beside the corresponding branching levels: 9, 7, 5, 3, 1.We know that, starting from number 1, such a progression gives squared numbers as partial sums:
![]() .
.
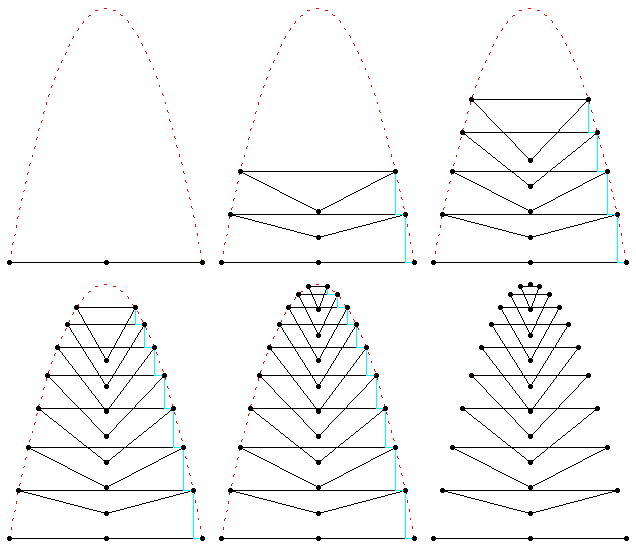
Thus we have an indirect suggestion of non-linearity. One may think that this interpretation of Klee’s sketch is a bit …a flight of fancy . On the contrary, there are other sketches which display the same branching process by inscribing the growing plant inside a parabola [22], similar to the one of Animation 11.

Here the whole process takes 10 steps. If we follow it along the central axis of the tree, we can see ten segments each of them of the same length, which would seem to express linearity. However Klee exploits just the non-linear properties of the parabola to symbolise the branching, because at each step in correspondence to constant
Dx decrements, the Dy increments are proportional to the odd numbers. Thus Klee uses the linear progression along the central axis just to emphasise by contrast the non-linearity of the whole process.Animation 11
The second example I will recall describes the changes in growth rate of a fruit
[23]; it is more interesting than the previous one, though the numerical series used by Klee to describe it is quite empirical. It is the following:1 -- 1.5 -- 2 -- 3 -- 4 -- 5 -- 4 -- 3
Using Klee’s words, the process start with a progressive increase, followed by its reduction. In qualitative terms, the numerical series fits to the to the behaviour of the logistic model: at first the growth rate increases ever more (exponential growth), but once its maximum is reached, it gradually decreases (asymptotic behaviour), according to the typical sigmoid growth curve. Obviously, in order to increase and then decrease the growth rate, it is necessary to express it by means of a non-linear form (a quadratic form, in the logistic model).
As a third example of non-linearity in growth process, I want to recall a typical among Klee’s module I have already discussed
[24]: the one of the overlapped rectangles. In fact it can also be taken as a good example of positive feedback loop which Klee often used, along with negative ones; examples can be found in the cited paper.
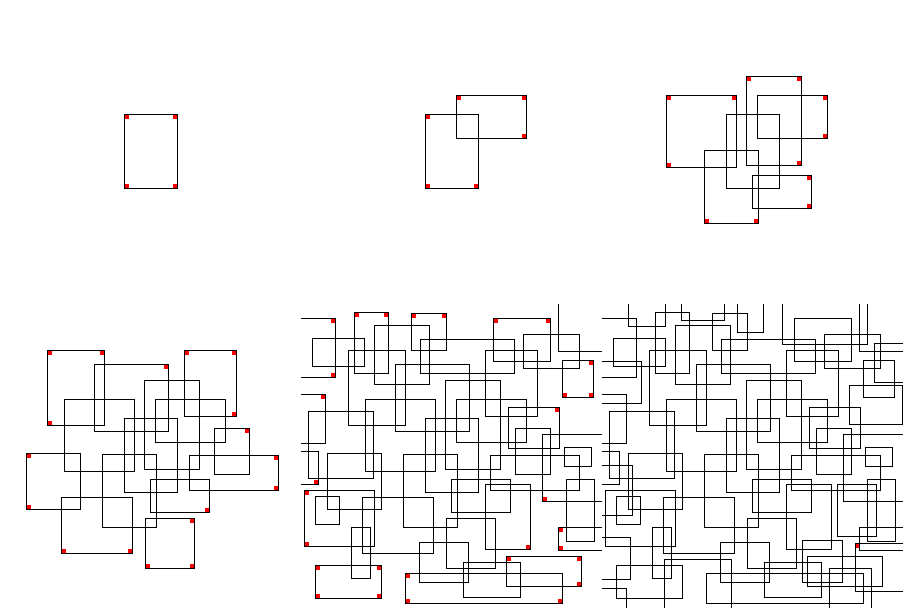
The rules governing the process follow: a simple rectangle is the starting point; the task is to cover its vertexes with vertexes belonging to other rectangles; in so doing, as we cover a vertex with another vertex of a new rectangle, we also introduce three new vertexes to be covered, which in turn need three new rectangles, each of them introducing three new uncovered vertexes, and so on. Animation 12 can help visualise the dynamics. Of course this growing process is non-linear (it is exponential).
Animation 12

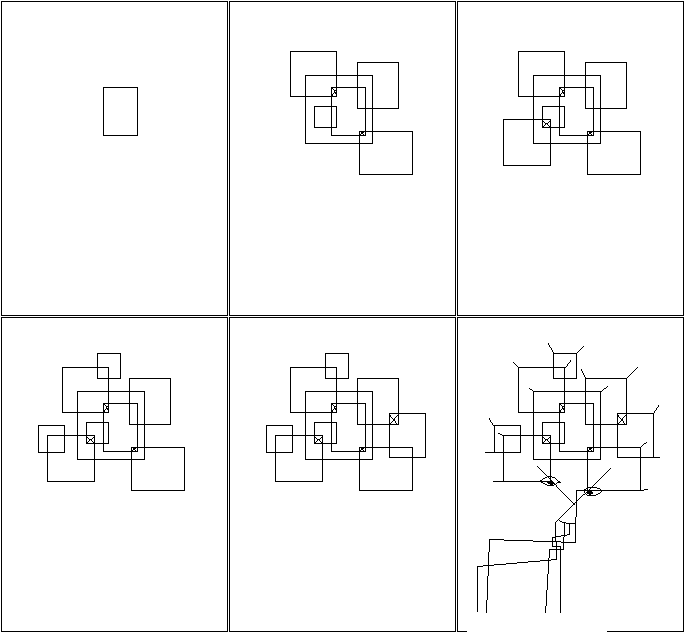
A good example of this module is the watercolour The deer (1919), where Klee depicts the majestic antler of the animal by means of overlapped rectangles (see Animation 13) which are growing more and more (relevant diagonal segments, posed in the most peripheral positions of the antler, point the direction for further growing).
Animation 13

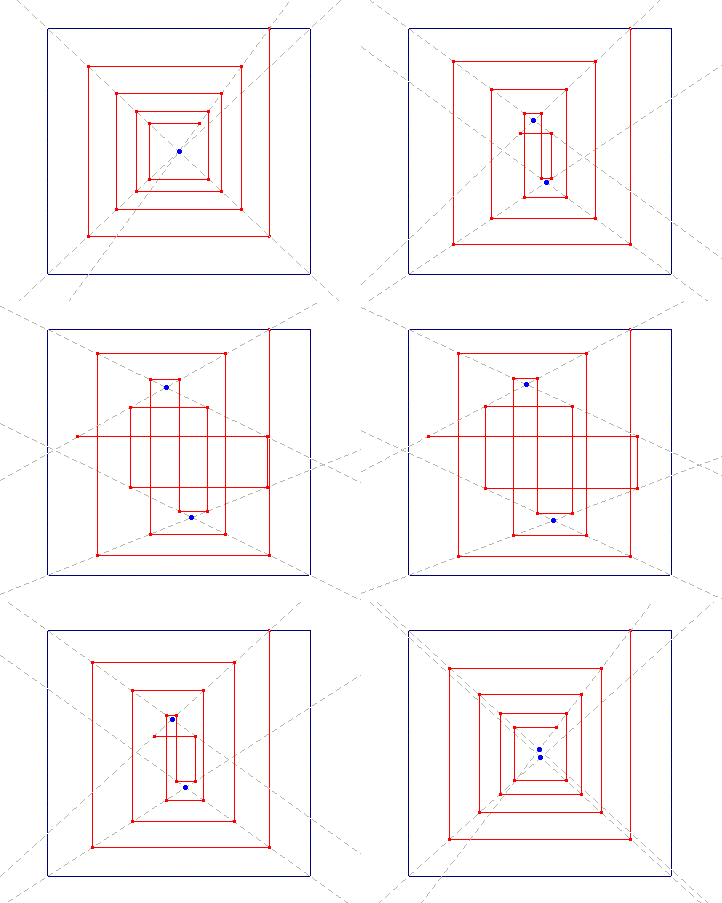
Now the problem was: how to stop such an exponential growth process? In the late 20’s Klee further deepened the module, and solved the problem with an interesting circular scheme displayed in Animation 14: the rectangles were substituted with a single right-angled polygonal line, which closed the pathway by returning to its starting point, generating patterns quite similar to those of the overlapped rectangles.
Animation 14

Interestingly, the digression on non-linearity ends by bringing us back to the exact point we left the discussion on the painting Chess: indeed Klee’s drawings, based on the polygonal closed line, recall the results one can obtain with the iterative procedure we saw in Animation 9, for both drawing with a single continue line, and for the overlapping of the right angles.
Animation 9
Thus we can refer the drawing of the discussed module to the chaos theme: in a way we can say that the overlapping procedure is iterative, non-linear, self-catalytic and circular, and the final results are quite chaotic; hence those drawings can also be seen as direct antecedents of the painting Chess, which indeed follows a couple of years later.
In fact, one of the most fascinating features of Klee’s thought is that everything is tightly connected with many other things seemingly disconnected, in a progressive, reciprocal and circular deepening of the concepts he dealt with.